


Hey there ProfitFarmers!
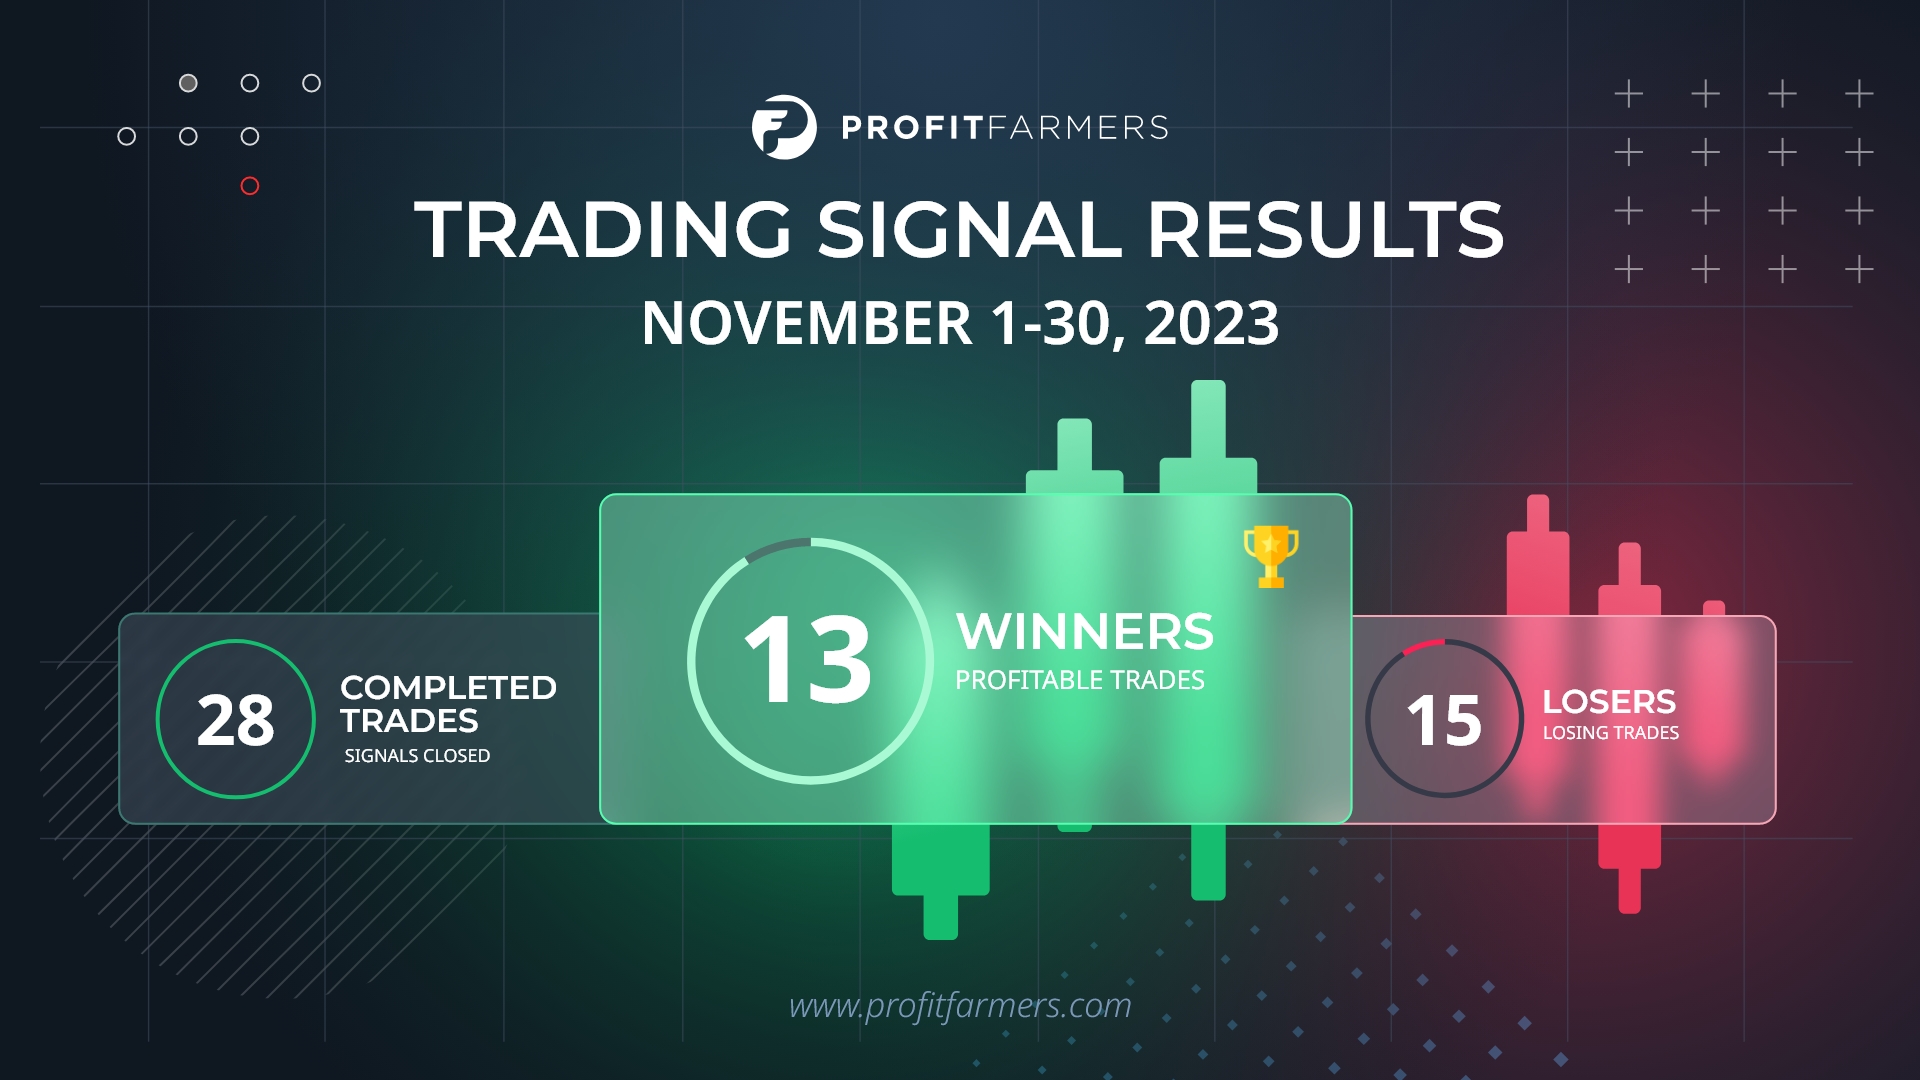
Here is the latest trading signals statistics update covering December 1-31!
Results Report Download
Download the latest results infographic now! Simply choose from the options below:
News
You might have noticed a Bitcoin all time high to 69k during November that nobody cared about, and then Bitcoin casually dropping 38% from it’s all time high on December 4 (dragging most cryptos down as it usually does).
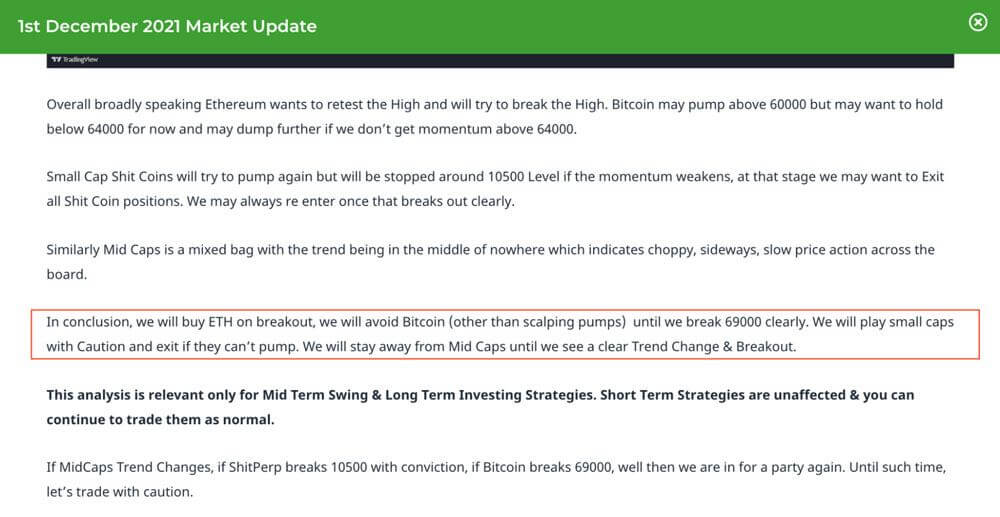
Luckily we’ve got Nostradamus reading the charts for ProfitFarmers – as we predicted the dip in this December 1 Market Update, and to those that heeded our warning should have been safe from carelessly trading during this volatile period.
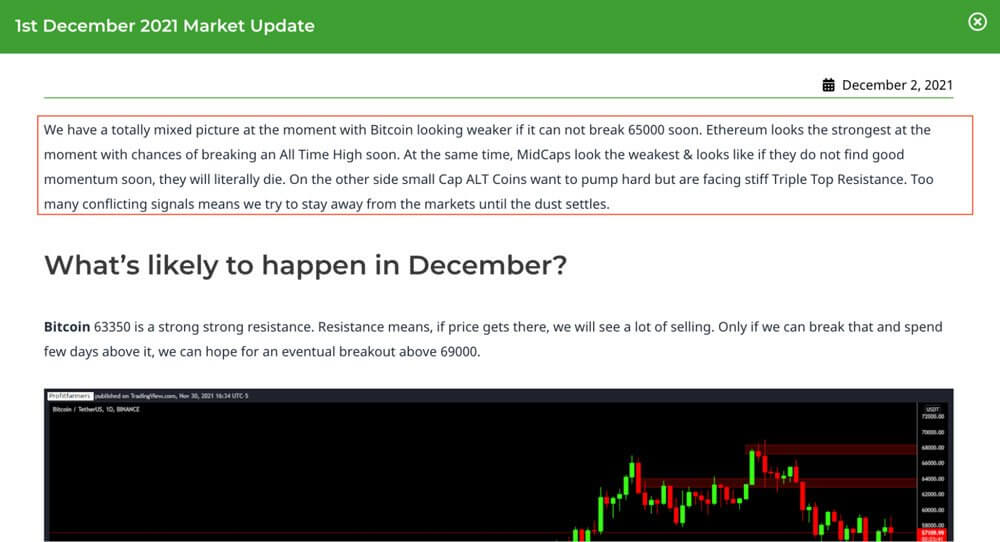
December called for caution so we didn’t make many trades, although we did make some signals the overall recommendation was to sit on your hands and wait.
Market Analysis using the MVRV-Z Score Metric
We’ve said in our November stats blogpost that we dont believe 69k was the top of this bullrun, and according to this model, it isn’t. We have to keep in mind the game has changed a little though in 2022 due to some escalating economic issues in China and the USA.
It’s called the MVRV Z-Score, created by Murad Mahmudov and David Puell in 2018.
It’s important we use tools like this in confluence with other analysis so that we don’t trade with emotions during dips or pumps. Bitcoin is the current king and its movement heavily affects the cryptomarkets, so analysing it will help us determine whether we are still in a macro bull market or if we’ve entered into a bear market and crypto winter.
This will also help us determine what types of trades we should take more of – obviously avoiding long term short trades and doing more long trades during a bull-run!
How does this model help us?
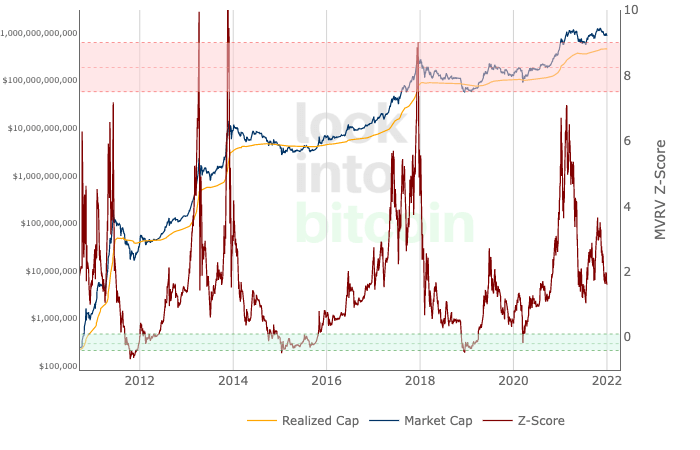
MVRV Z-Score uses blockchain analysis to identify periods where Bitcoin is extremely over or undervalued relative to its ‘fair value’.
It uses three metrics:
- Market Value (blue line): The current price of Bitcoin multiplied by the number of coins in circulation.
- Realised Value (orange line): Rather than taking the current price of Bitcoin, Realised Value is calculated by taking the price of each Bitcoin when it was last moved. For example, the last time it was sent from one wallet to another wallet. It then adds up all those prices and takes an average of them. After which it multiplies the average price by the total number of coins in circulation.
By doing so it removes the short term market sentiment that we have within the Market Value metric. Therefore, it can be seen as a more ‘true’ long term measure of Bitcoin value which Market Value moves above and below depending on the market sentiment at the time. - Z-score (red line): A standard deviation test that pulls out the extremes in the data between market value and realised value.
How do we use it?
Whenever the Z-Score hits the horizontal dotted red line (a score of 7+) then we can safely deduce that the market is slowly getting overheated and taking profits (with BTC) during this time is a good idea. For altcoins, it usually takes 2-3 weeks for altcoins to hit a peak after a BTC top.
It is also historically accurate to say that whenever a Z-score is higher than 7, BTC is nearing its bullrun top. Bullrun tops have usually been followed by year long bear markets and the dreaded crypto winter. You DON’T want to be position trading (long positions) or HODLing any coins during this time.
Here’s the live chart in case you want to add this tool into your analysis.
Here’s the medium article for a more detailed explanation of this model.
Conclusion: What does this mean for the Bull-run?
During this entire bullrun, the Z-score never touched the horizontal dotted red line. Not 64k during April and not 69k during November. So calls that those prices were the ‘top’ are statistically incorrect (according to this metric).
Right now the Z-score is below 2, although it’s quite scary seeing BTC drop 40%, exiting your long positions (for long term trades) at this point will be extremely premature*. As it stands with the MVRV Z-score metric, we are nowhere near the end of this bull run, so… sit on your hands and be patient!
*Do not take this as financial advice! This is a personal opinion based on the chart data.
Headline numbers
Now back to our stats! Although we’ve had better months, ProfitFarmers has done well during this time of high volatility, as you will read in our December 2021 stats update down below.
During this month, our algorithms generated 39 signals in 31 Days across the various strategies.
That’s an average of 1.2 seed signals closing every single day for our members all around the world.
When you break down the winners and losers we saw about 64% of them hitting at least target 1. Not bad considering December was a sad month for crypto!
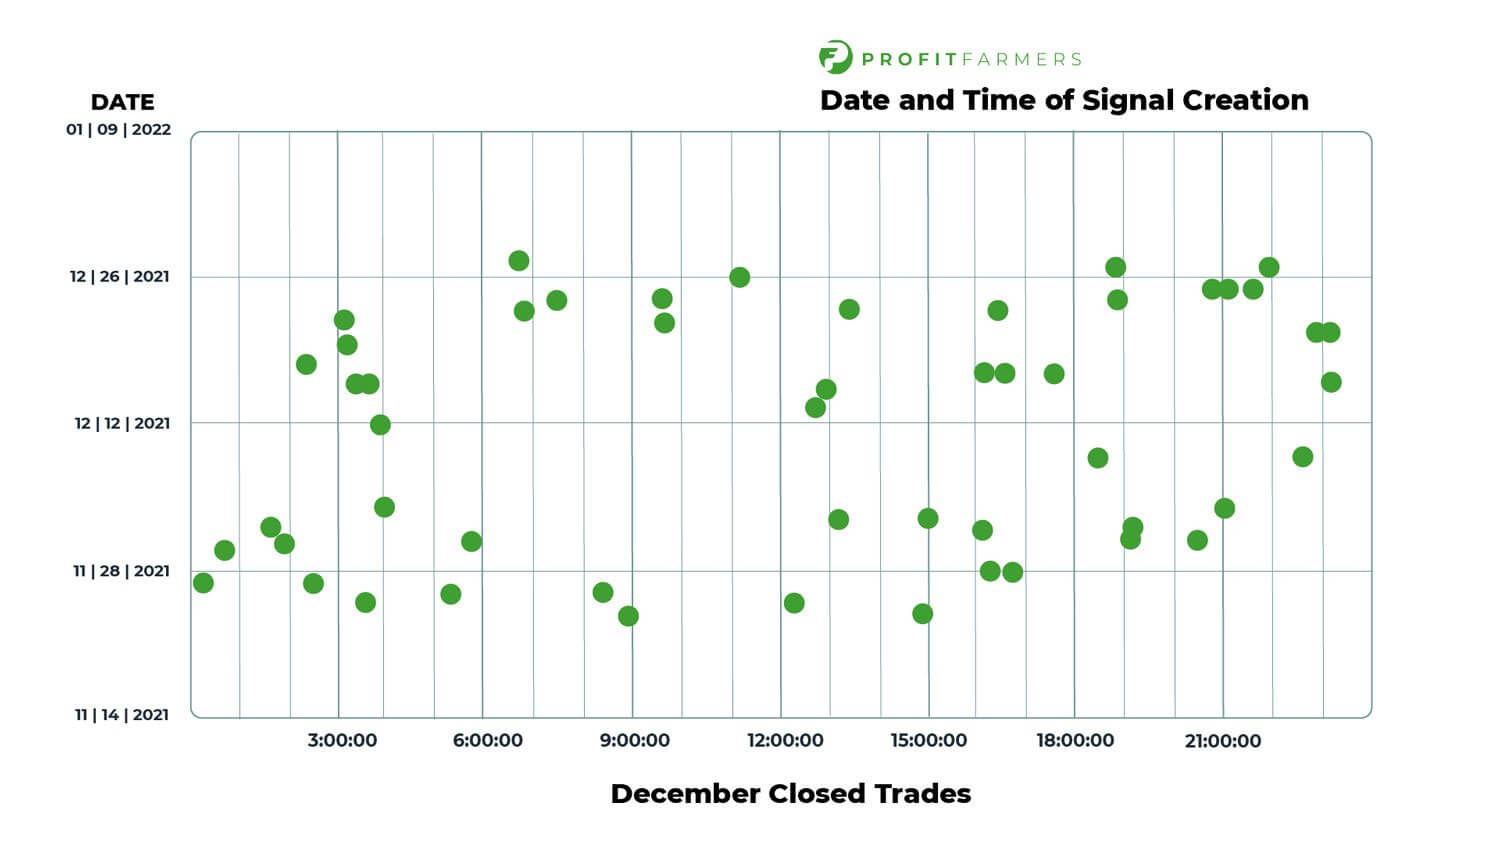
When do we publish signals?
Our signals are produced algorithmically. Meaning that they may appear at any time of the day! Here’s a graph showing when our signals were created for the month of December.
Our Favourite Trade
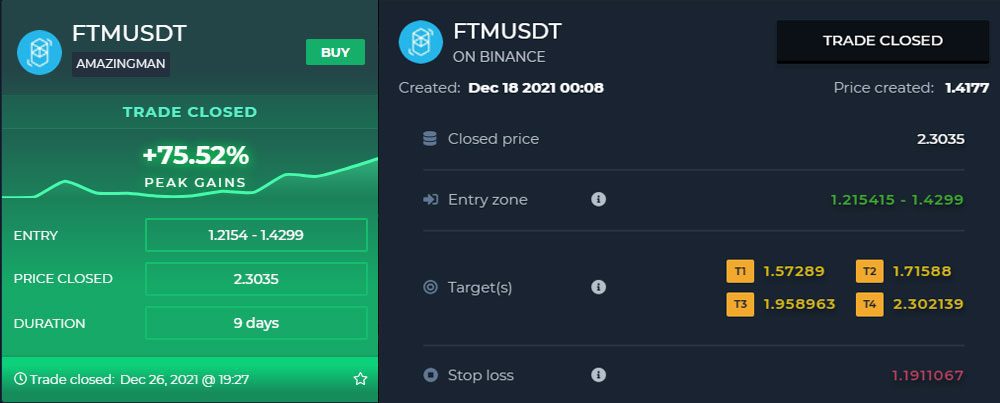
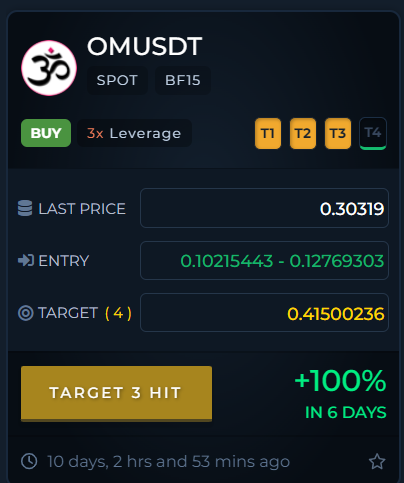
Our favourite trade over this period came on December 18 thanks to FTMUSDT.
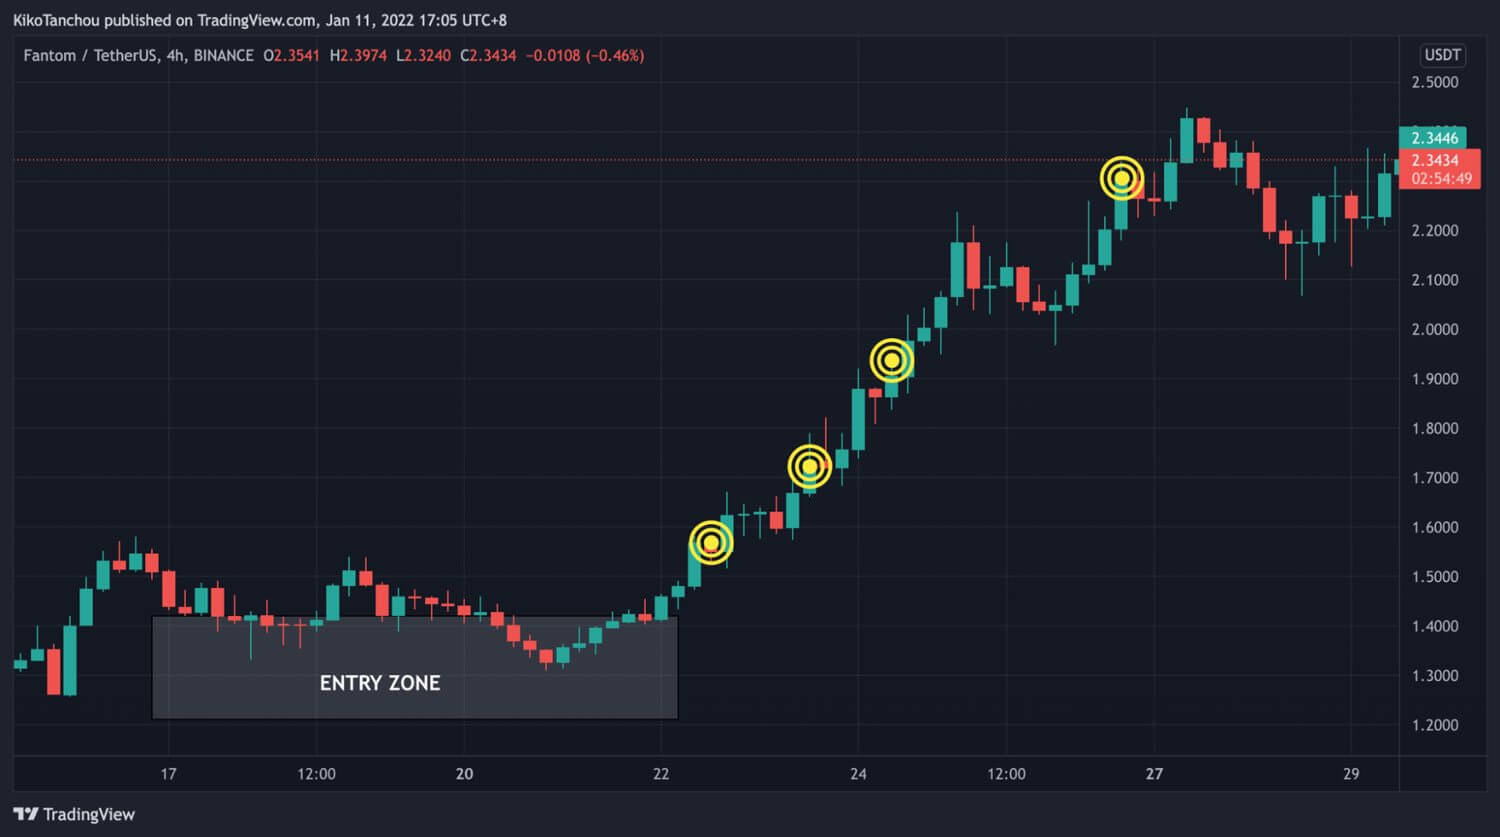
The Amazingman Strategy did it for us again this month! This signal caught this FTM pump beautifully.
As you can see, our Algorithms just found a profitable long trade that garnered 75% of gains (in only 8 days!) during a downtrend.
It’s like one of those moments when you find a glass of ice cold water after getting lost in the Sahara. You can lose a few trades without an issue if you can then pick up a massive win like this!
Target spread and profit per target
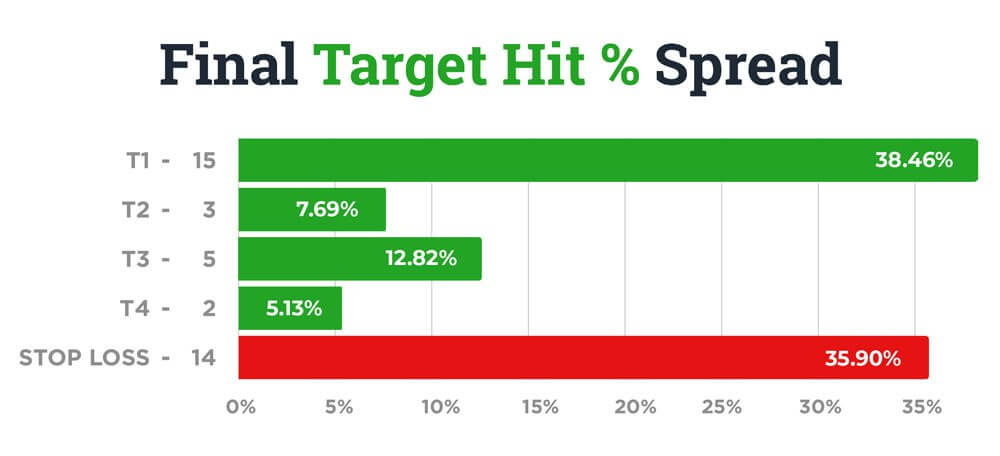
Most of the signals only reached target 1, which is no surprise considering the downtrending environment. Savvy traders would have been locking in profits at the early resistances other than for strongly trending coins such as FTM.
The average profit from each entry looks like this:
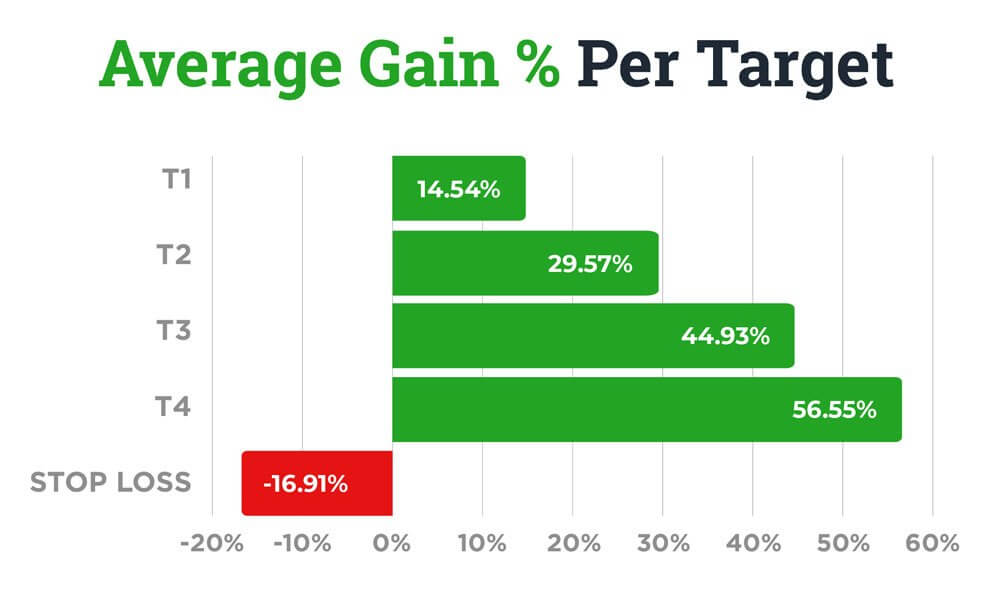
That means that despite the dip, our signals have been generating some decently profitable opportunities!
Around 38% of trading signals generated hit Target 1 and achieved a peak profit of +14%!
Around 8% of trading signals generated hit Target 2 and achieved a peak profit of +29%!
Around 13% of trading signals generated hit Target 3 and achieved a peak profit of +44%!
Around 5% of trading signals generated hit Target 4 and achieved a peak profit of +56%!
Average Depth
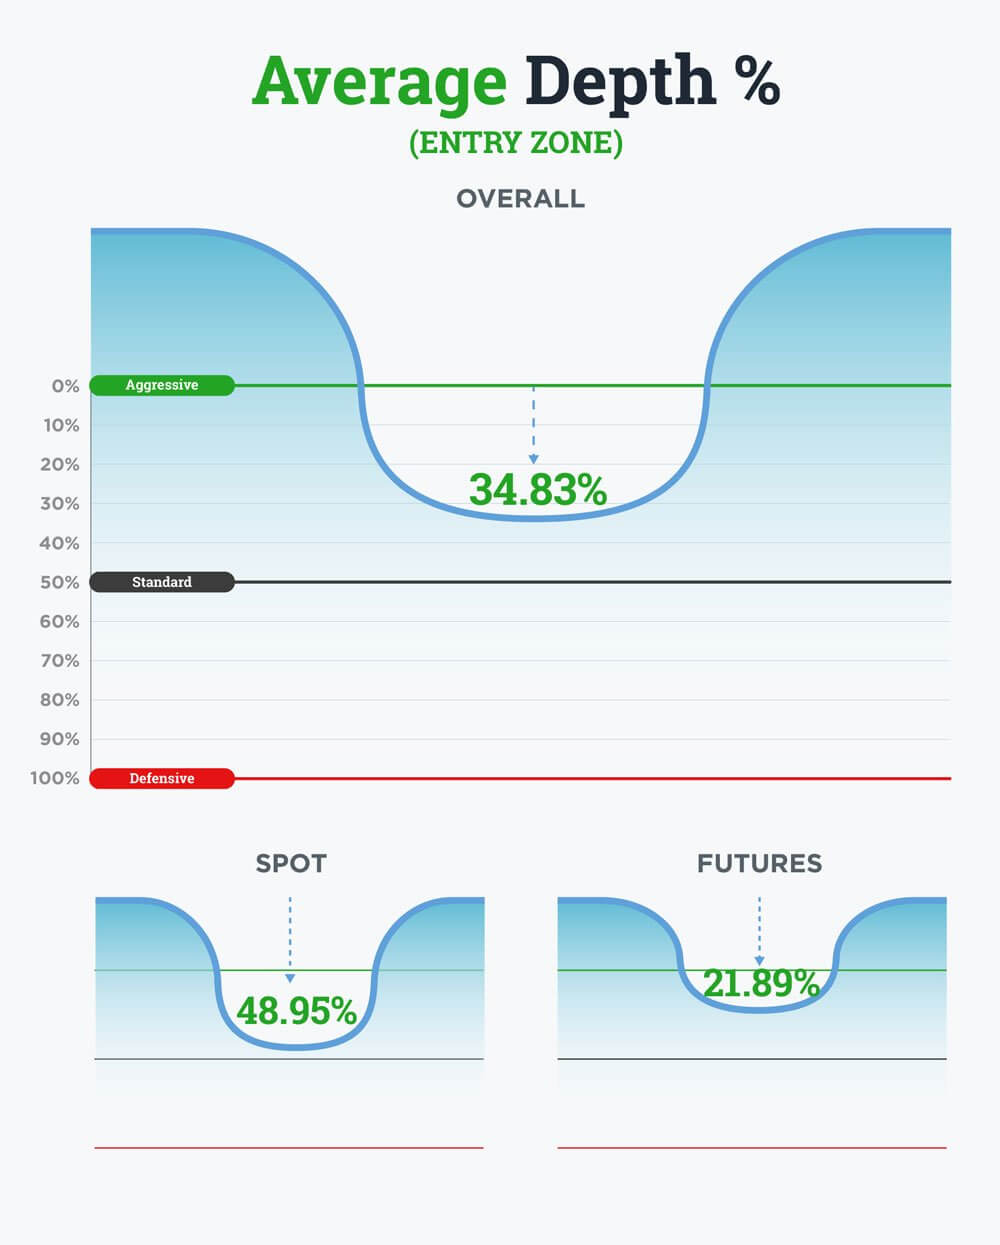
Based on our average depth, the ideal way to play this month is to set your entry prices to around 48%* from the top of the buy zone if you were trading Spot or Around 21%* if you were trading Futures.
*Keep in mind that this is not always indicative of future results.
Top 10 Trades
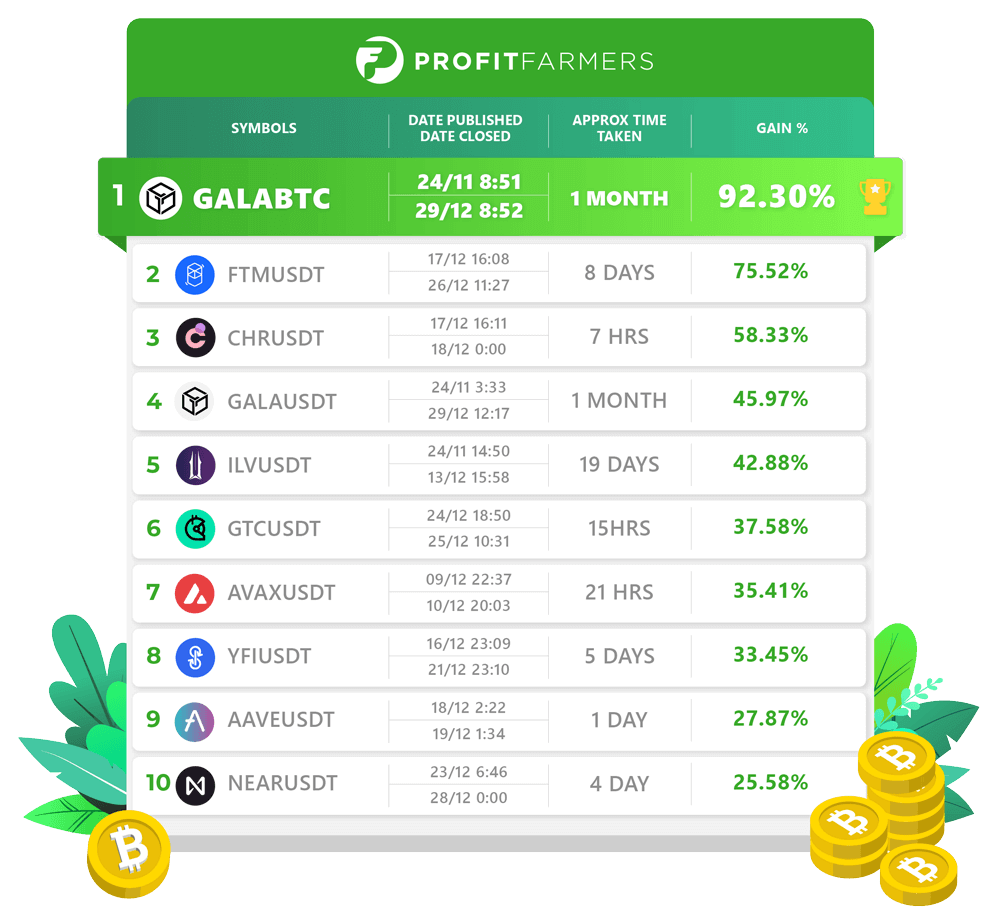
FTMUSDT was our favorite trade, but our most profitable trade goes to GALABTC, achieving a 92% gain in 1 month. We’ve been trying our best to handpick good trades for our members despite the backslide with the Crypto markets during December, so our top 10 is quite diverse.
But that’s crypto for you! Let’s look forward to a better and more profitable 2022. We are wishing you a happy new year, ProfitFarmer!
Want to join the fun?
Be more profitable and start making trading work for you again.
Join ProfitFarmers and:
- Copy expert trading signals in a few clicks
- Spend more time in the real world
- Get off the emotional rollercoaster
See you all next time!


