


An RSI screener is a timesaving trading tool that highlights overbought and oversold assets, helping traders quickly spot high-probability price reversals and make profitable trades.
Here’s how it works…
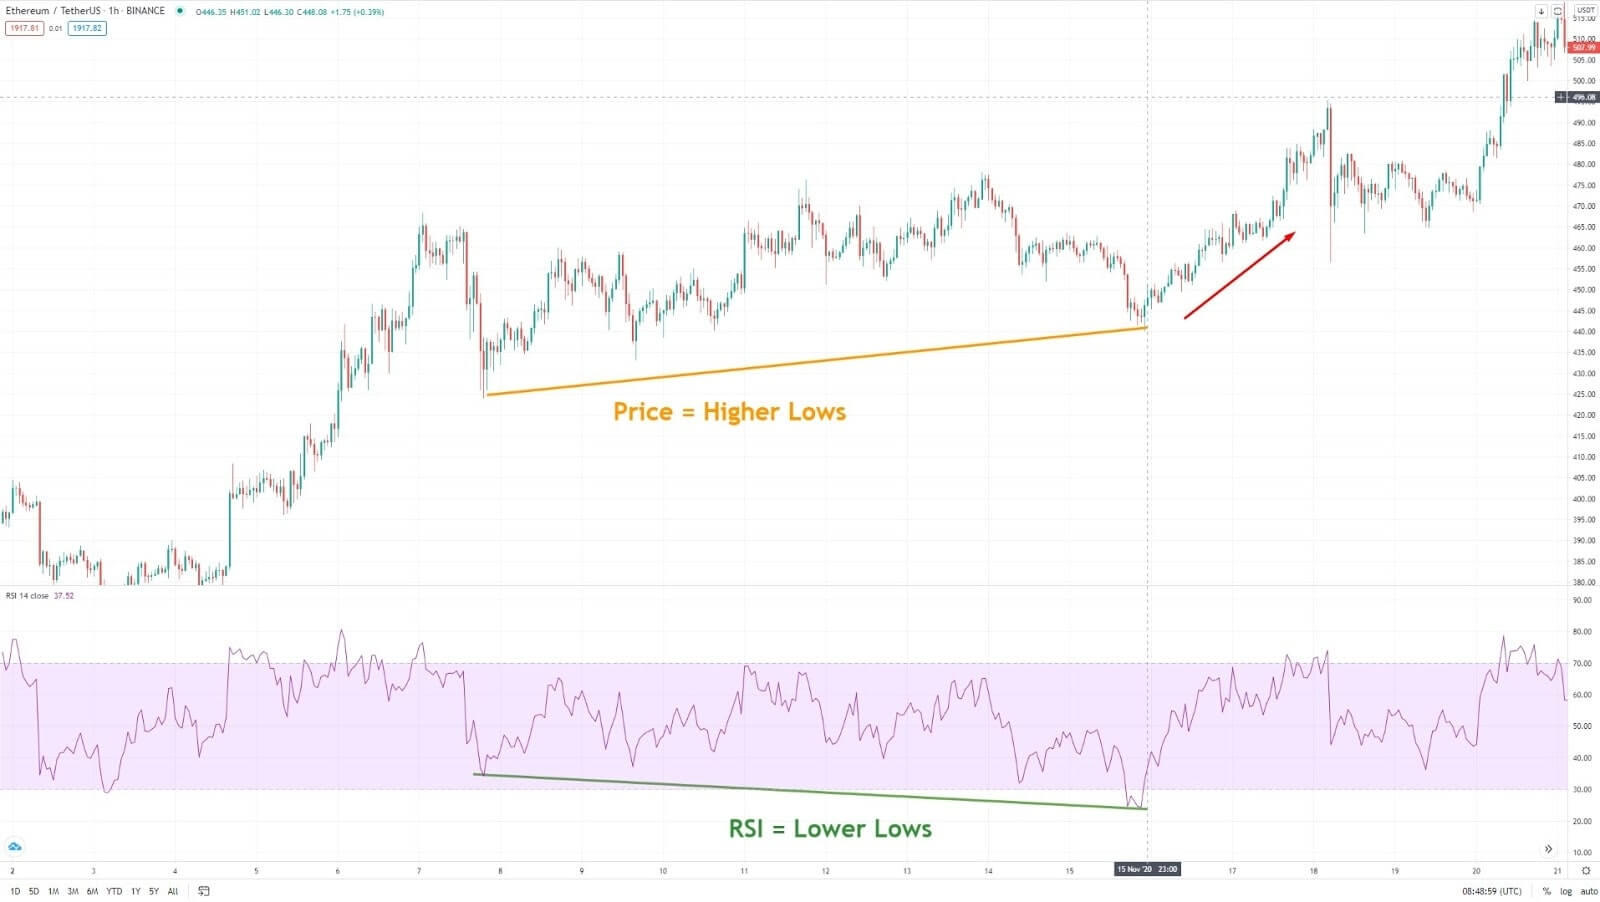
There are times when people buy too much or sell too much of a coin. When that happens, there’s often a correction – meaning the price moves in the opposite direction. If it’s being bought too much, it’ll drop. If sold too much, it’ll rally.
These reversals are some of the easiest, most reliable gains in the entire crypto trading world. What our screener does is highlights interesting price actions and shows you when a reversal might be coming. It’s not 100% guaranteed to happen – nothing ever is – but it just points it out and says “hey you, look here. There might be something interesting going on”. This saves you from having to constantly research and monitor the market looking for interesting price action (which could take hours and hours).
If you find yourself struggling to make winning trades, our RSI scanner will help identify winning trade opportunities quickly without needing to do much research or technical analysis (though you should still do as much as you possibly can).
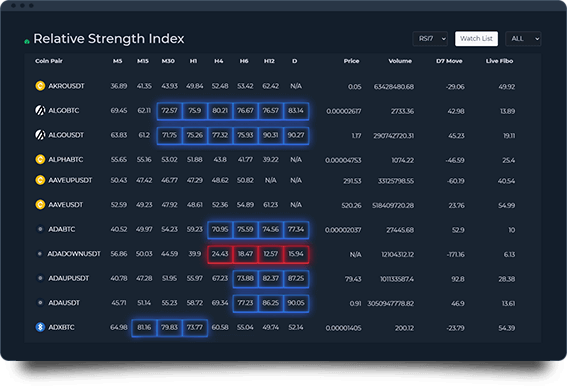
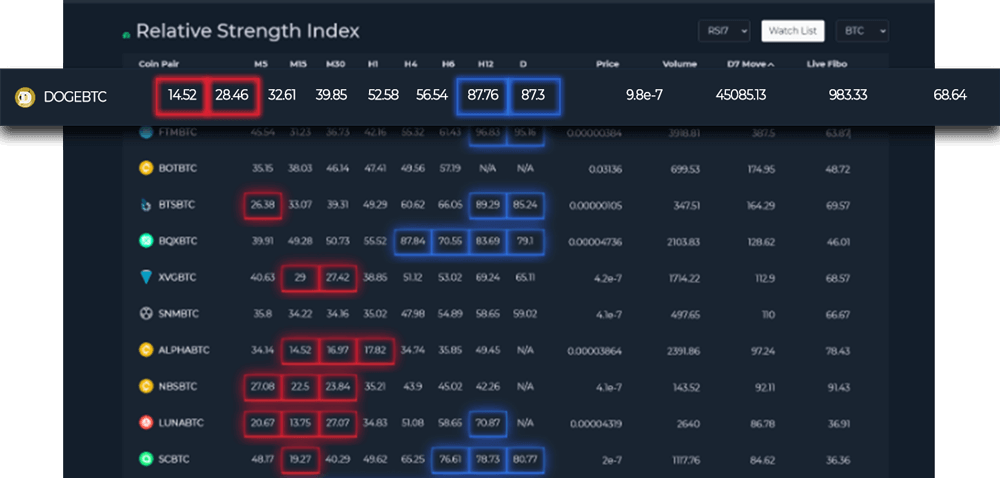
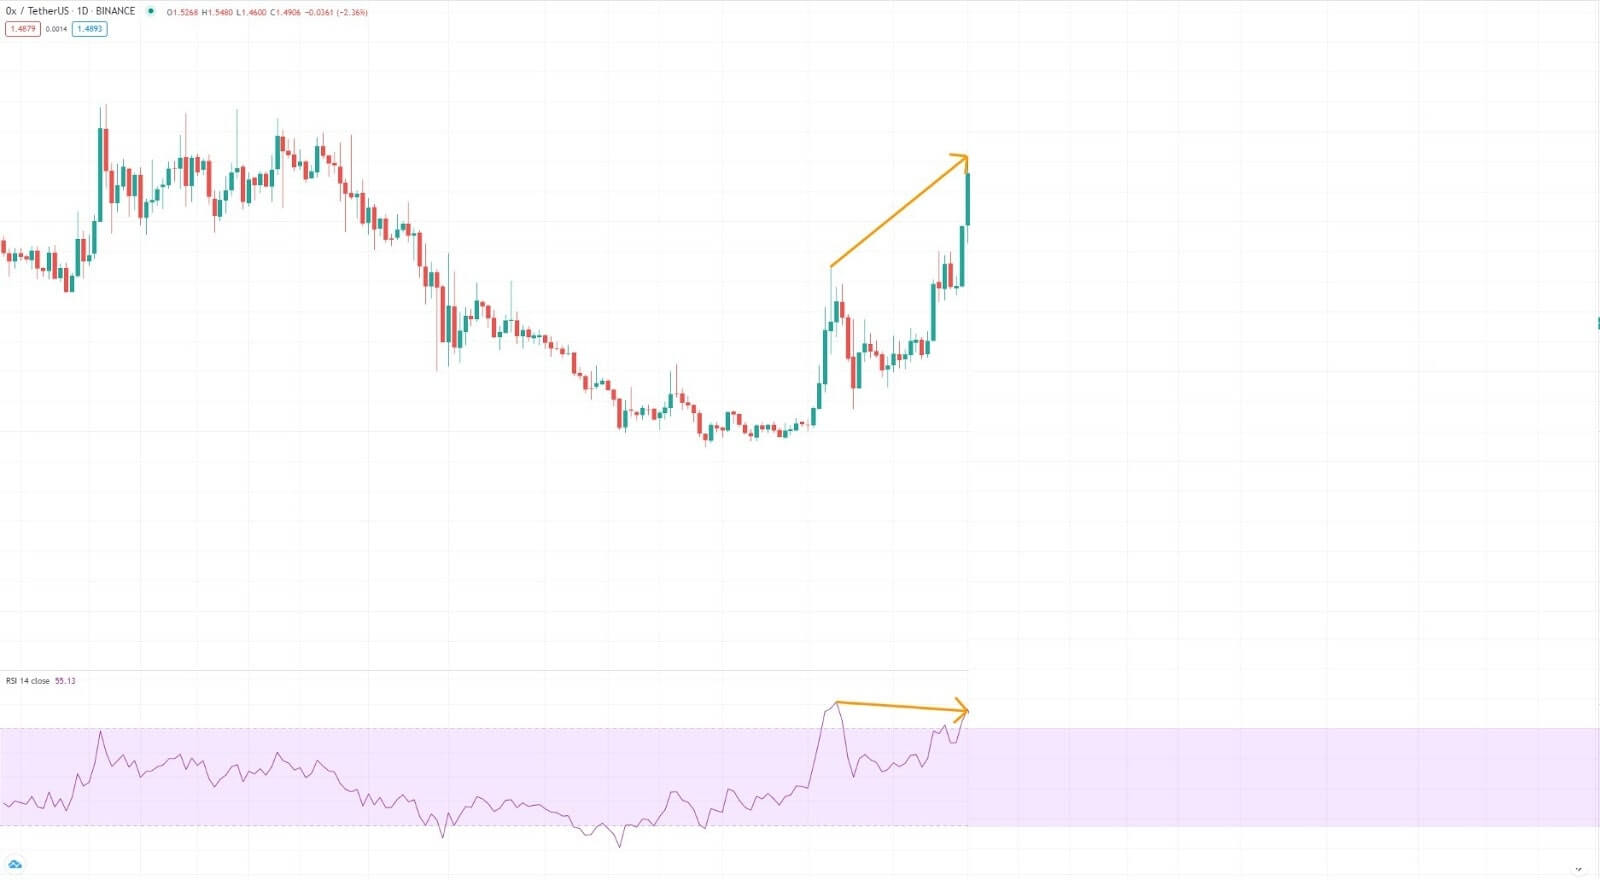
Example of how overbought coins are displayed:
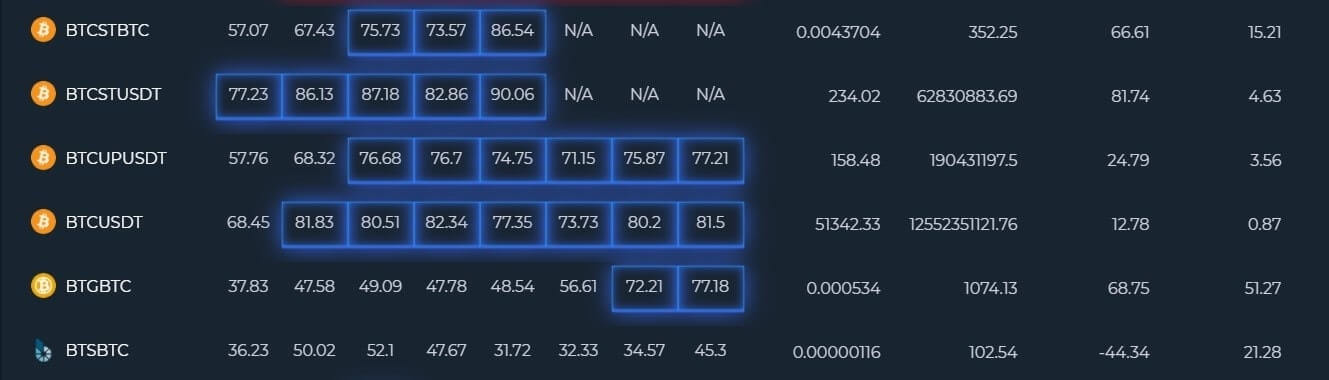
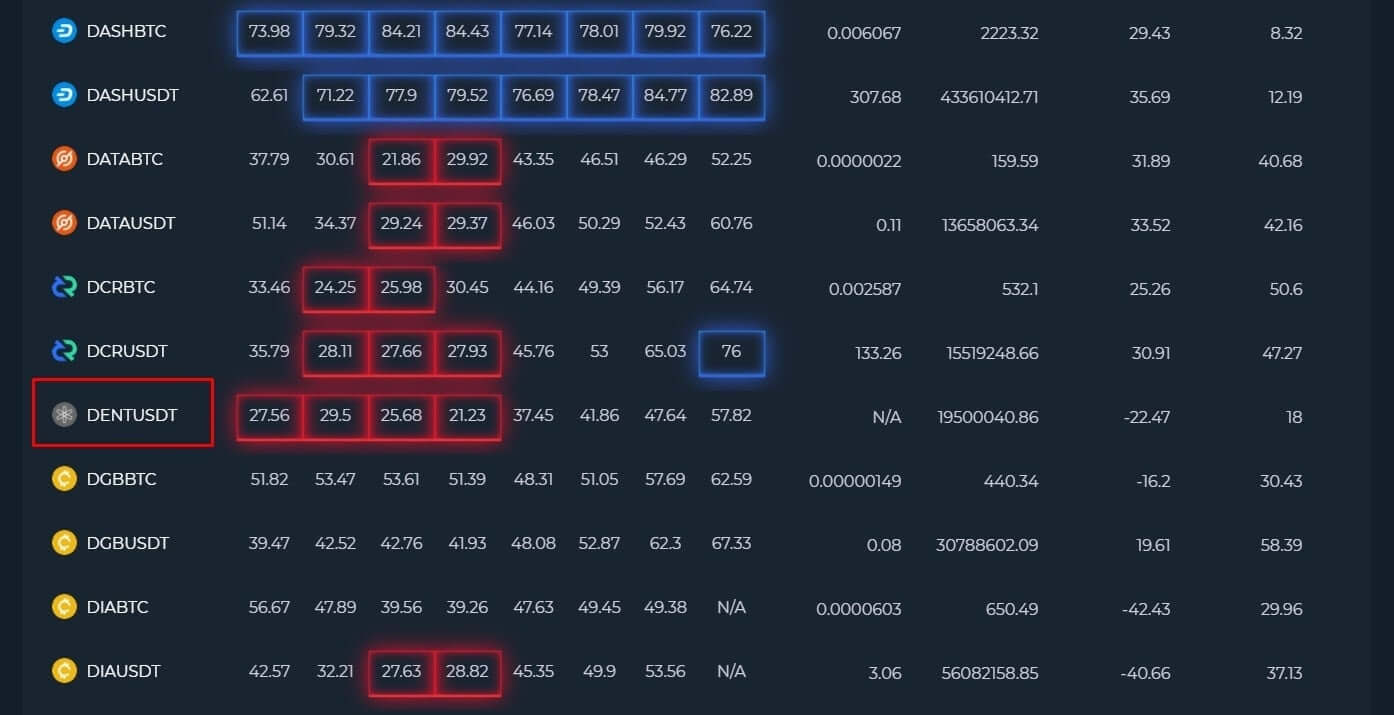
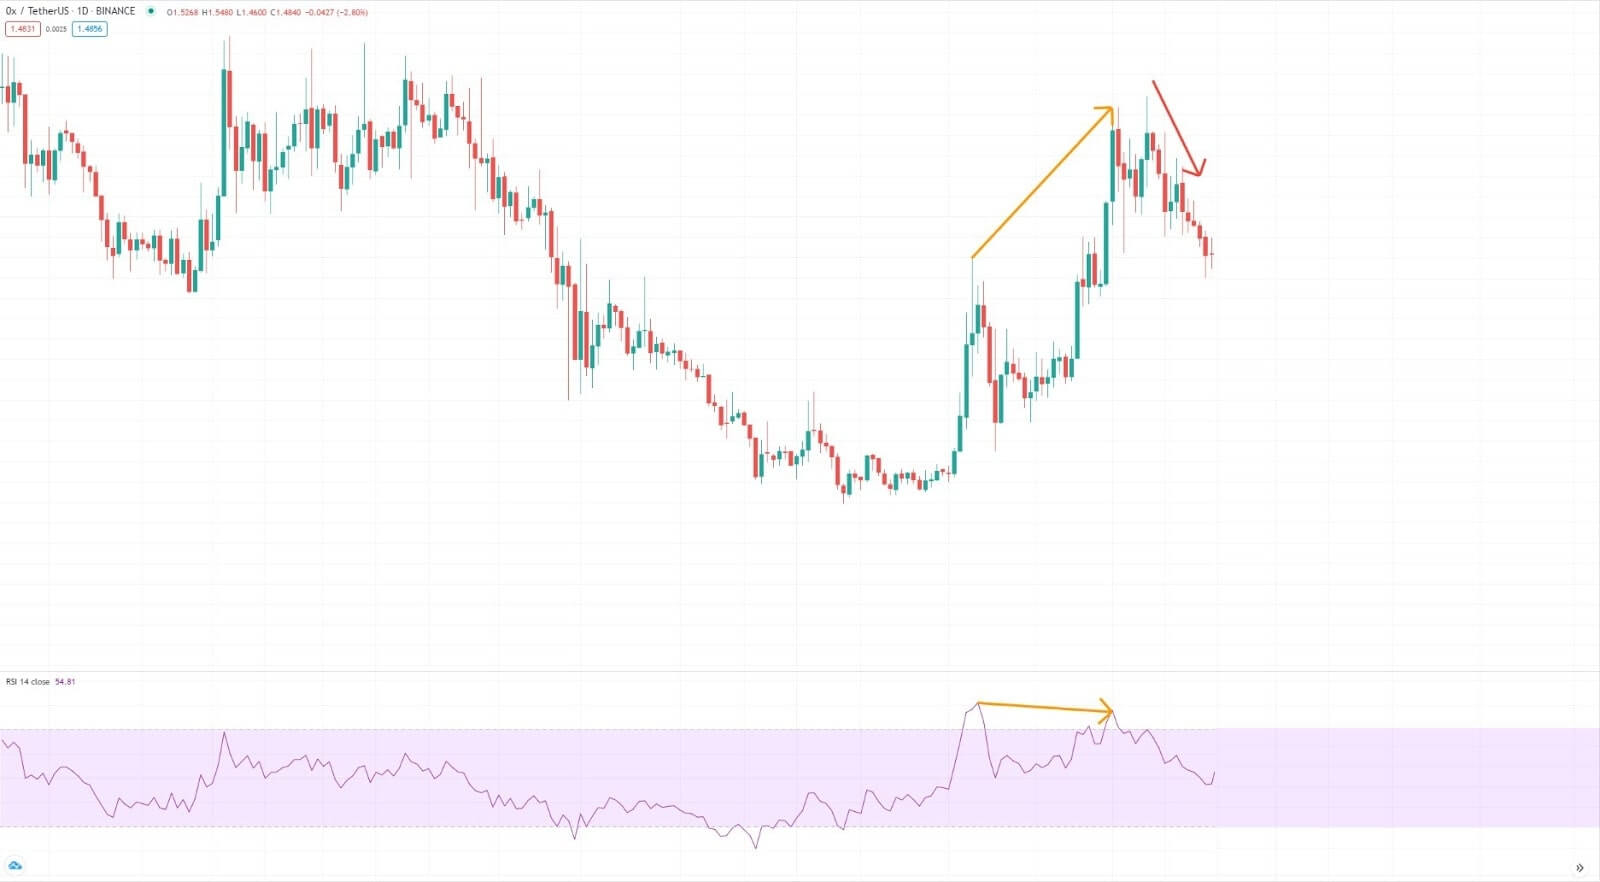
Example of how oversold coins are displayed:

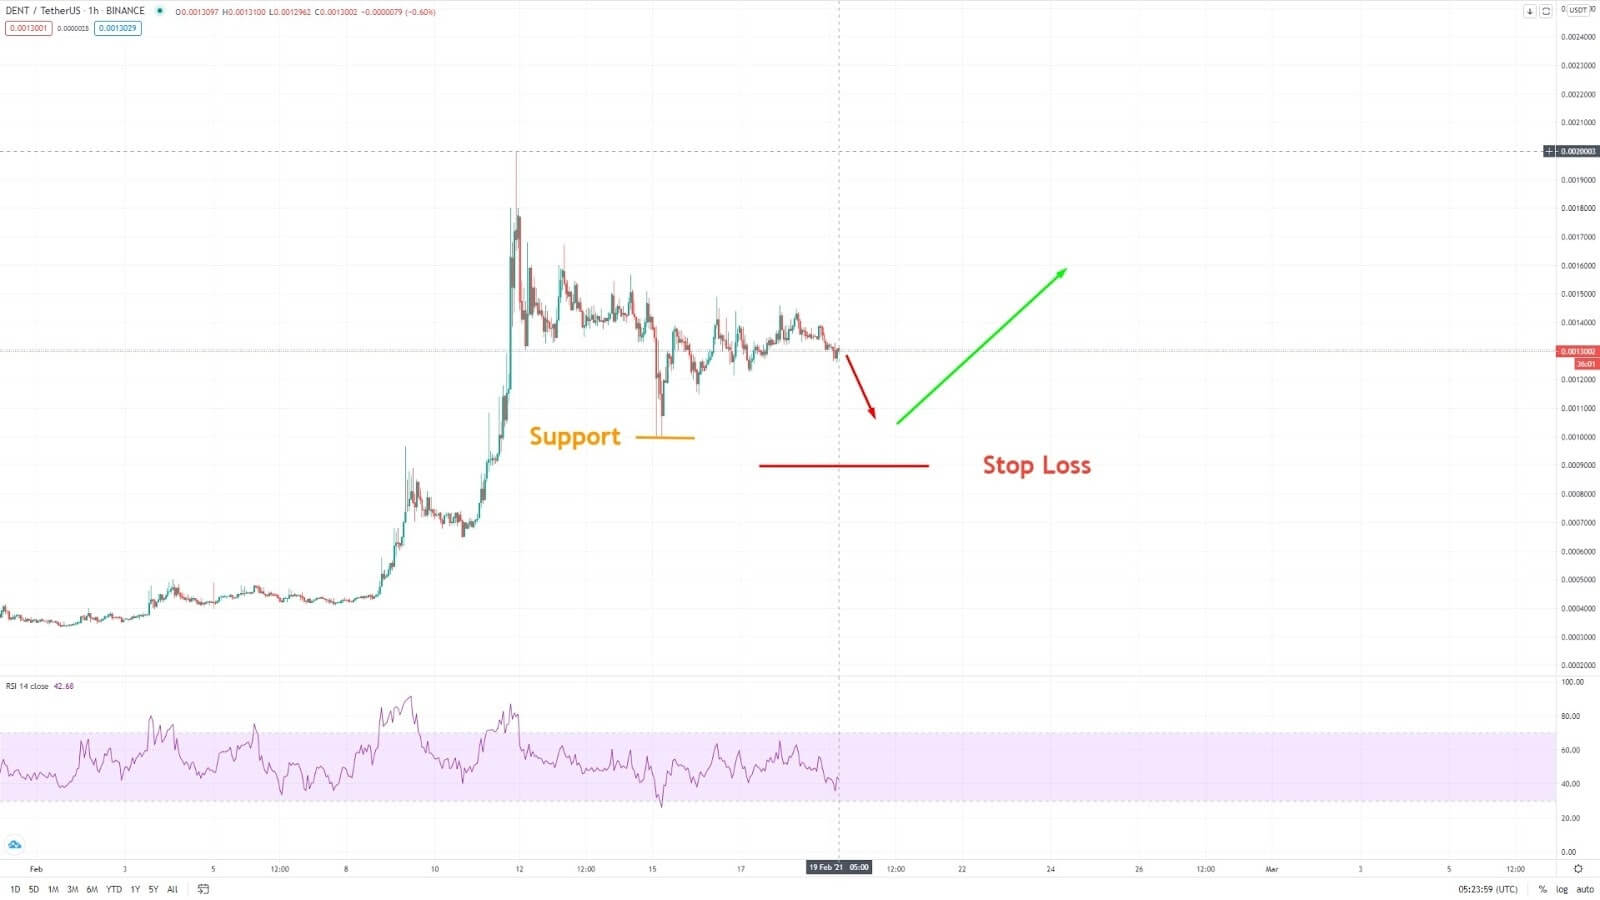
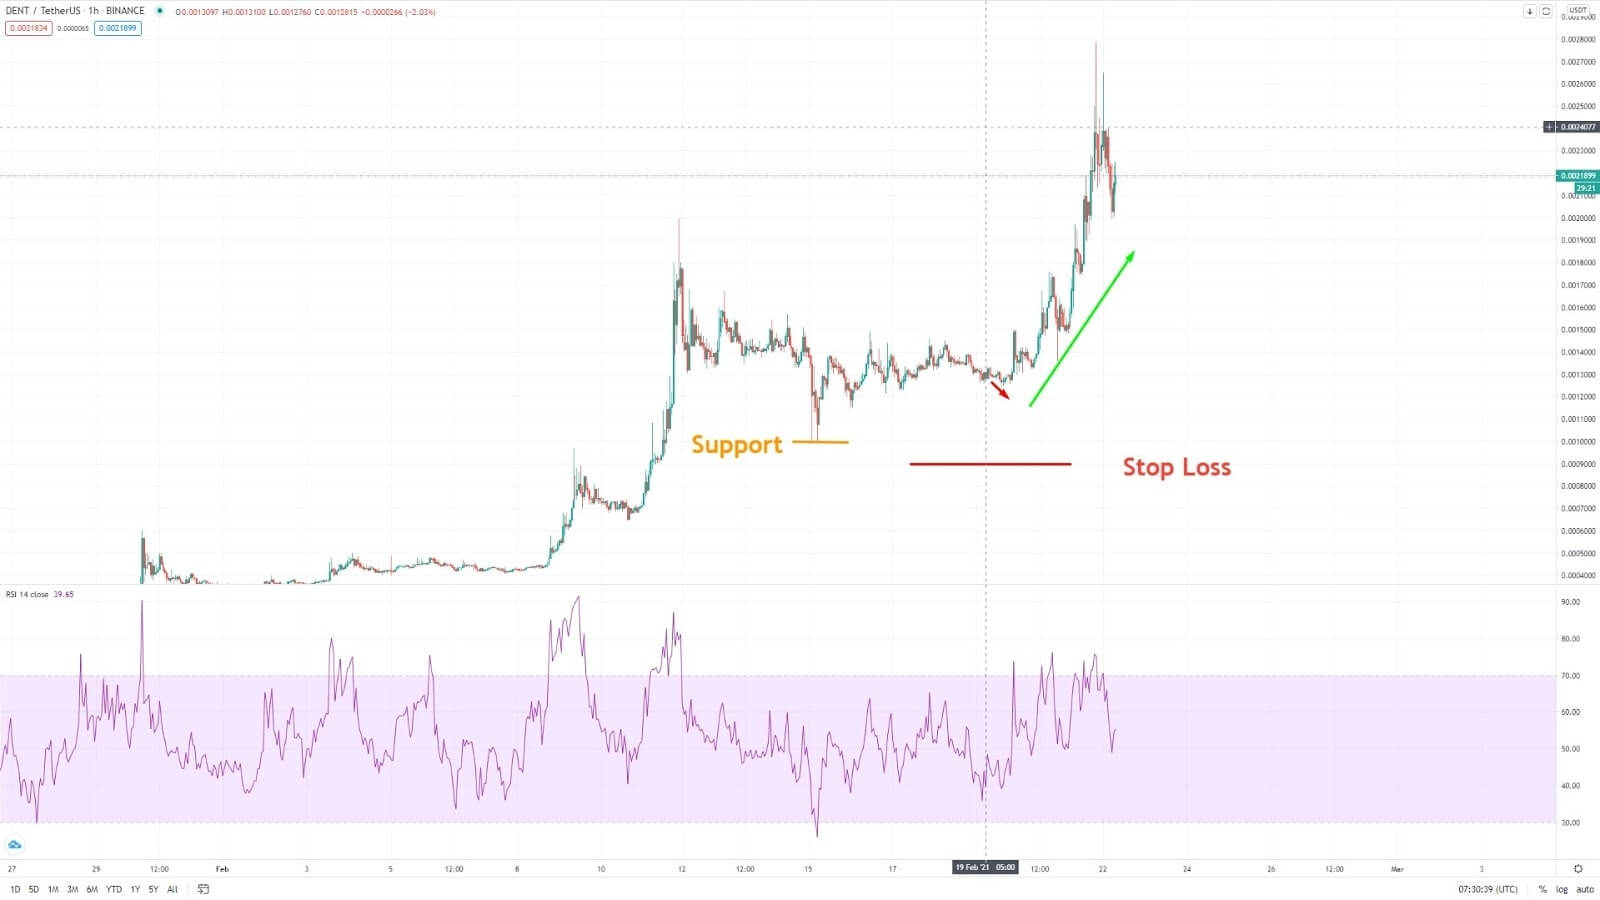
Overbought and oversold are very good indicators that a pullback or reversal may be in place. This doesn’t mean that you should use this as the only basis for all of your trading decisions but do recognise its importance.
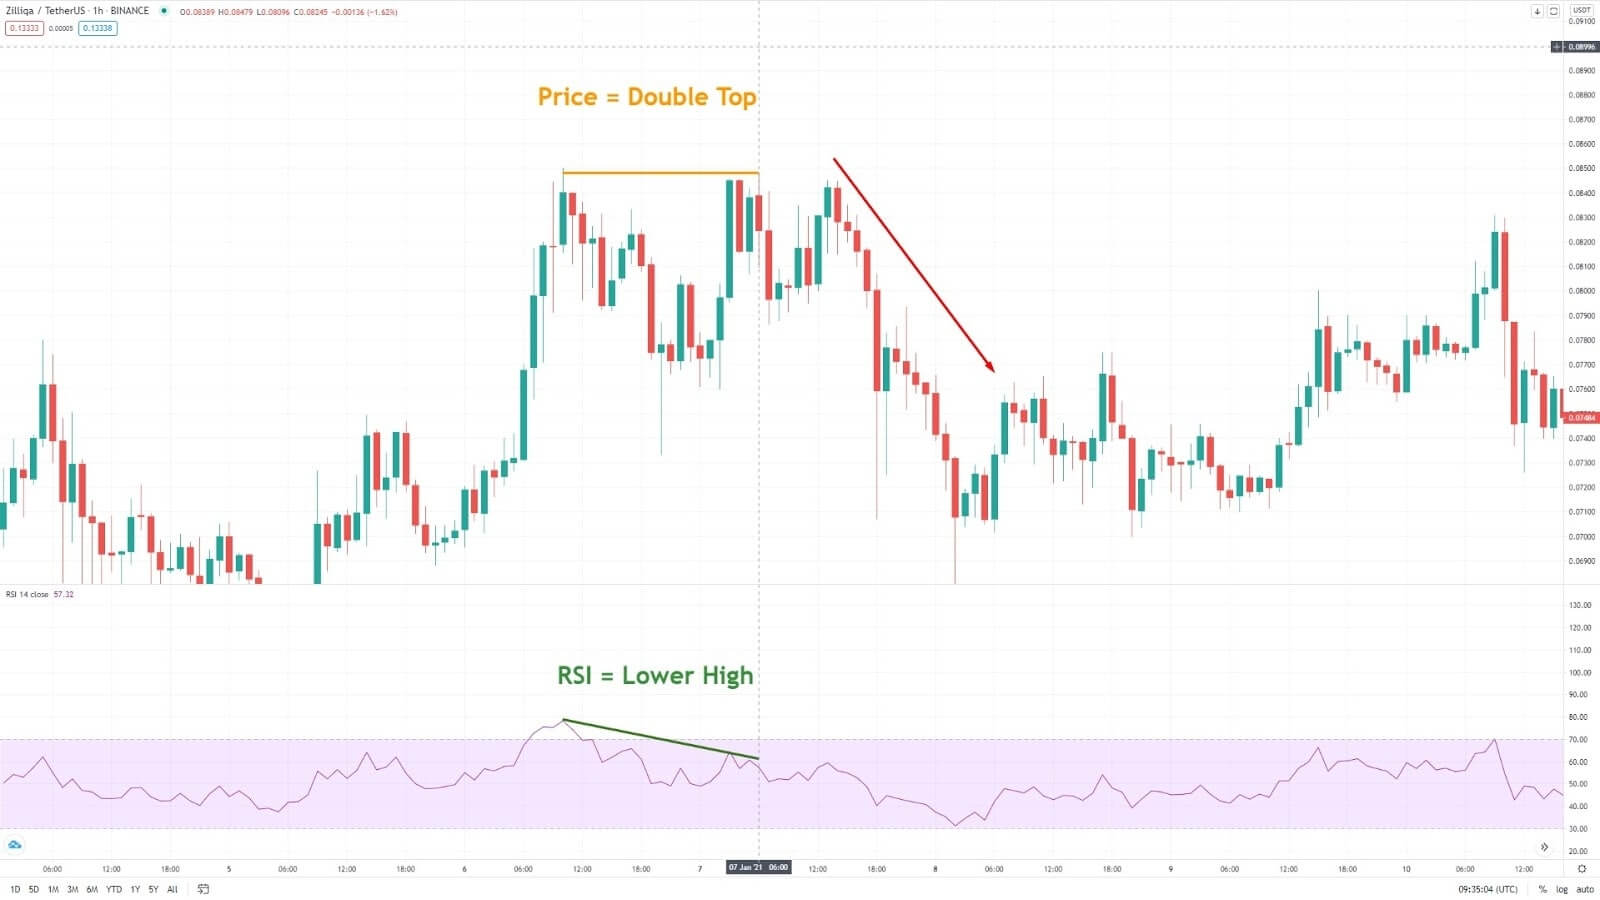
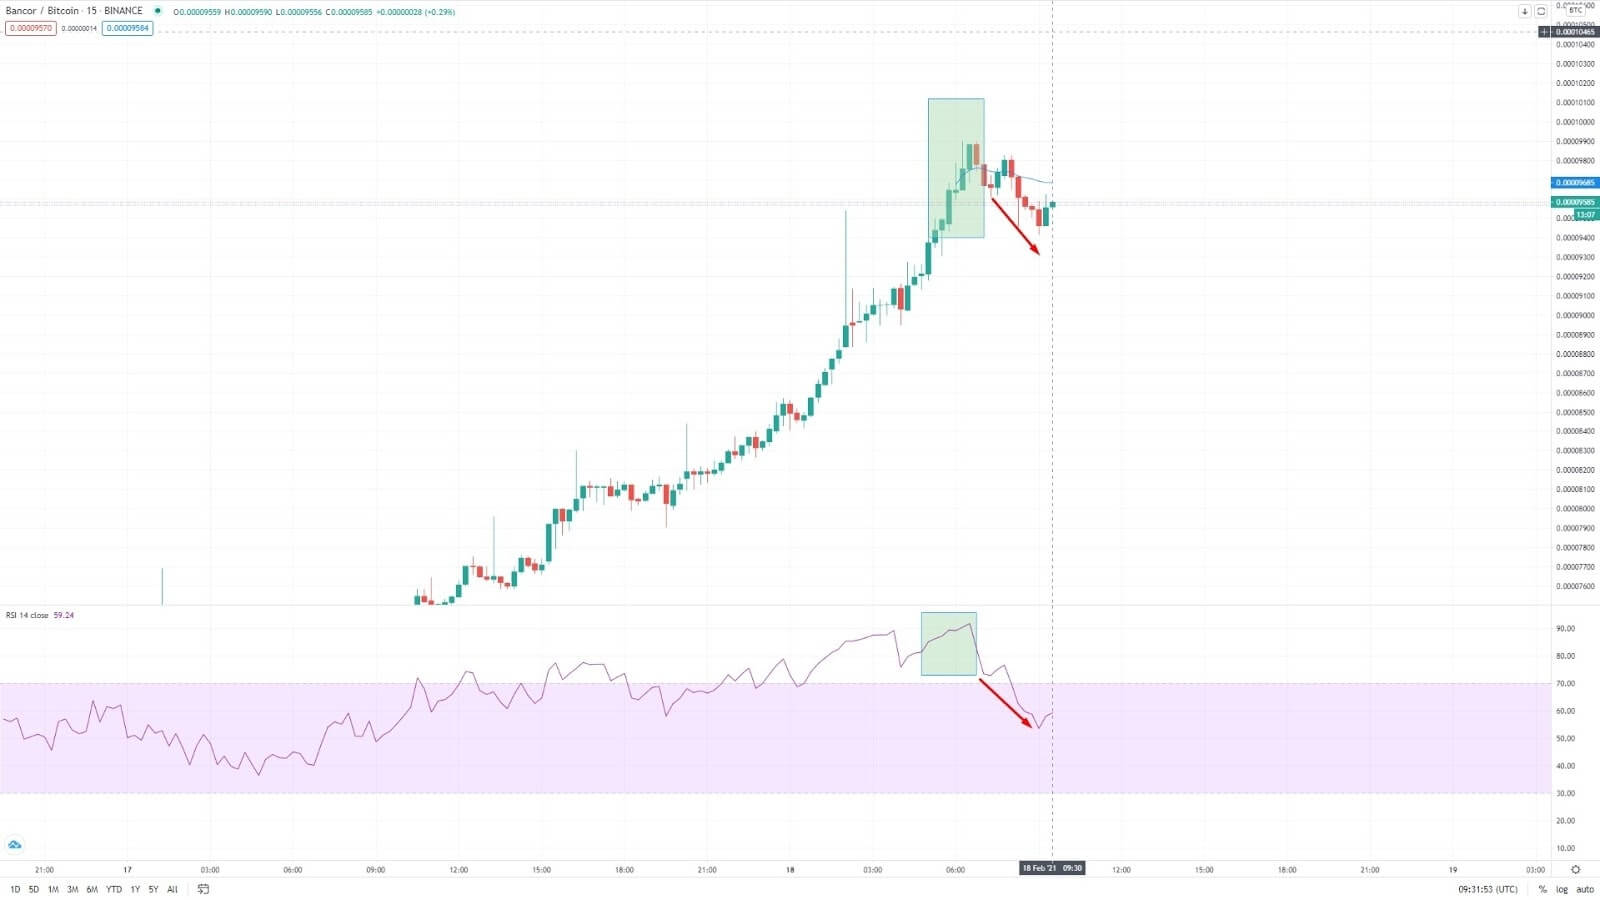
This is how RSI is represented on a chart (Below the MTLUSDT candlestick chart):
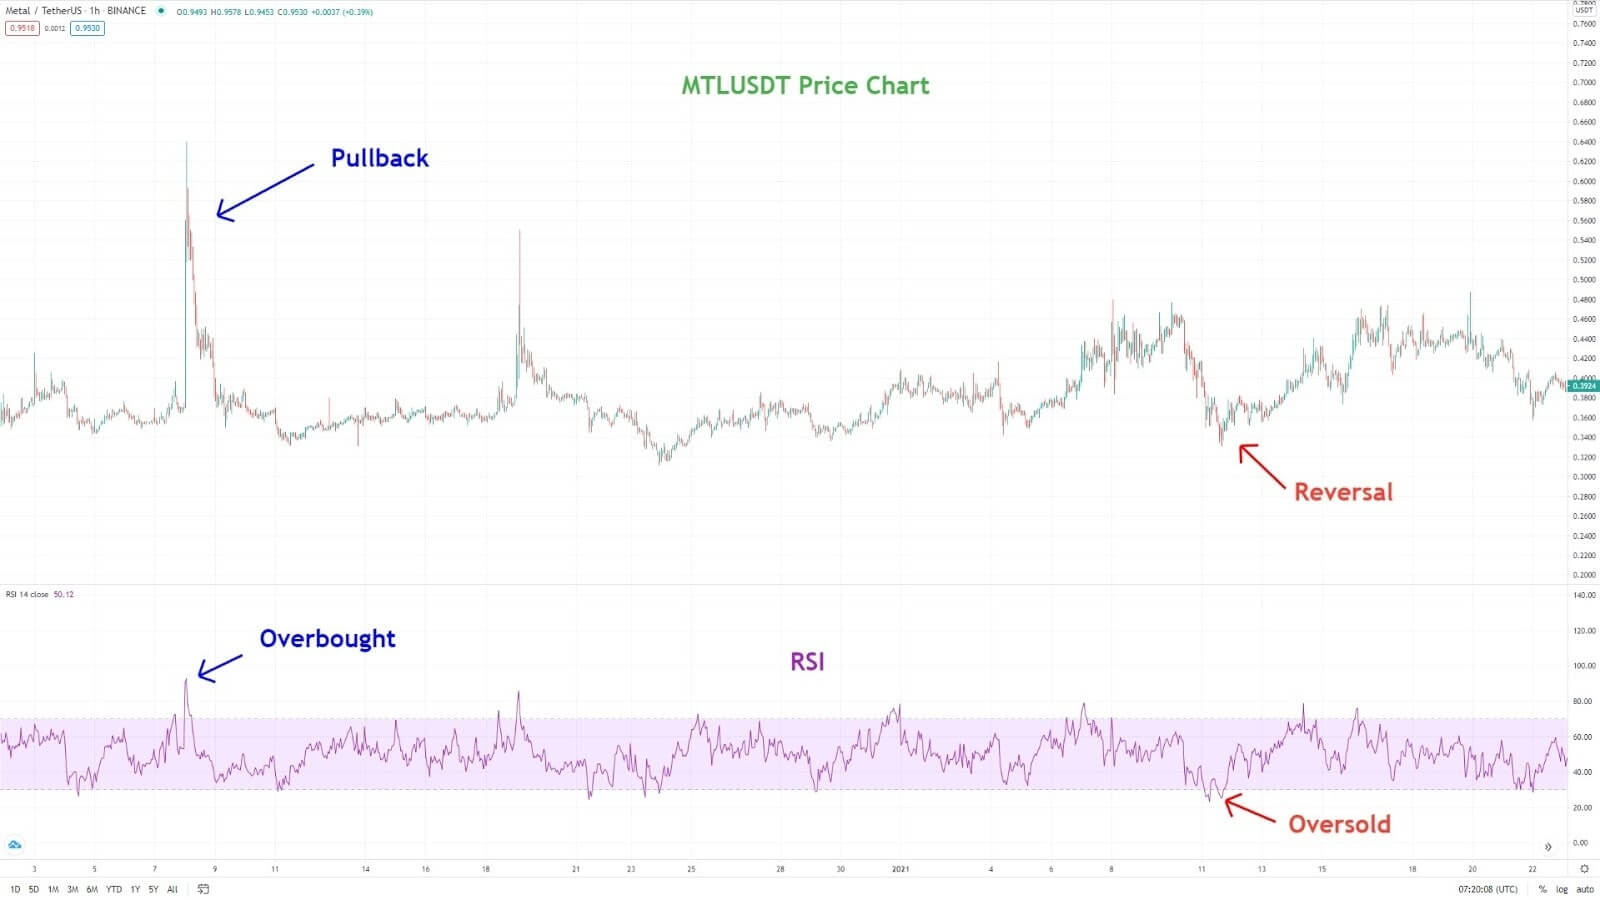
When MTL’s RSI breached above 70.00, it was overbought and saw a pullback (price went down).
Later on, when the coin reached well into oversold territory (below 30.00), a reversal (price went back up) occurred.
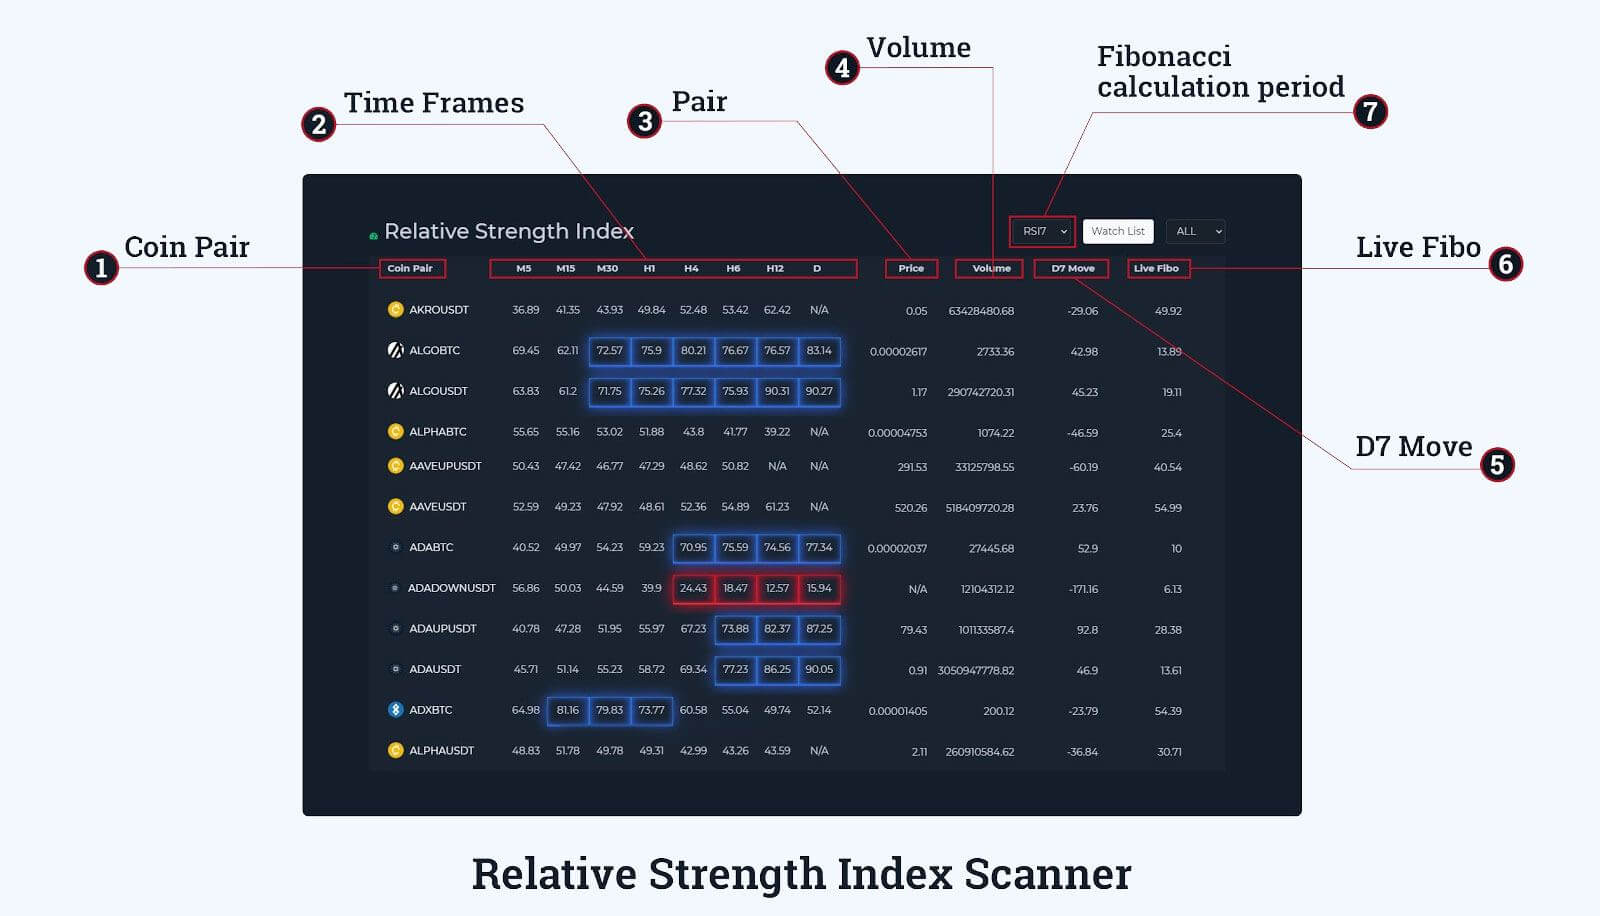
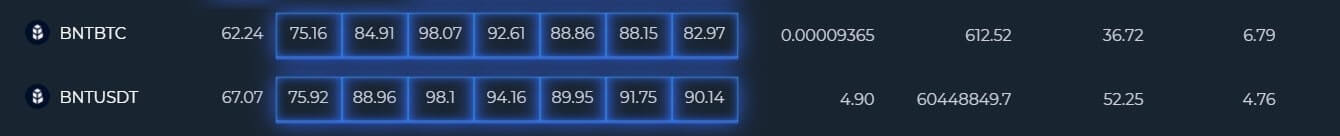
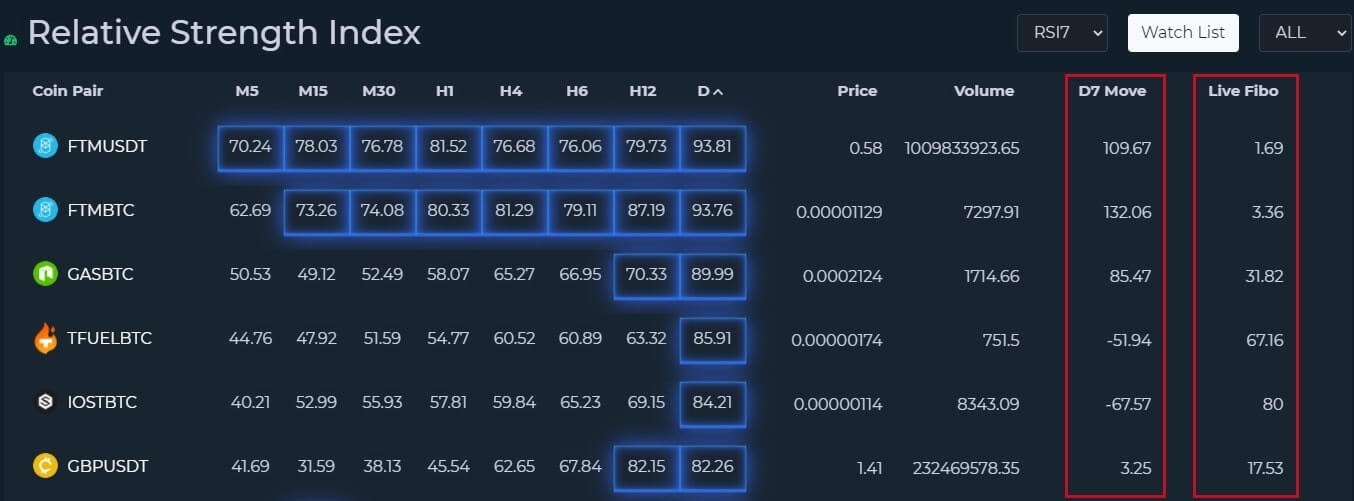
Using the RSI scanner, we can quickly see which assets have been overbought. In the image above we can see the BNTBTC trade has been overbought across time frames except for M5.
If you’re looking to make short term trades, consider looking at the RSI Scanner’s 5, 15, and 30-minute time frames.
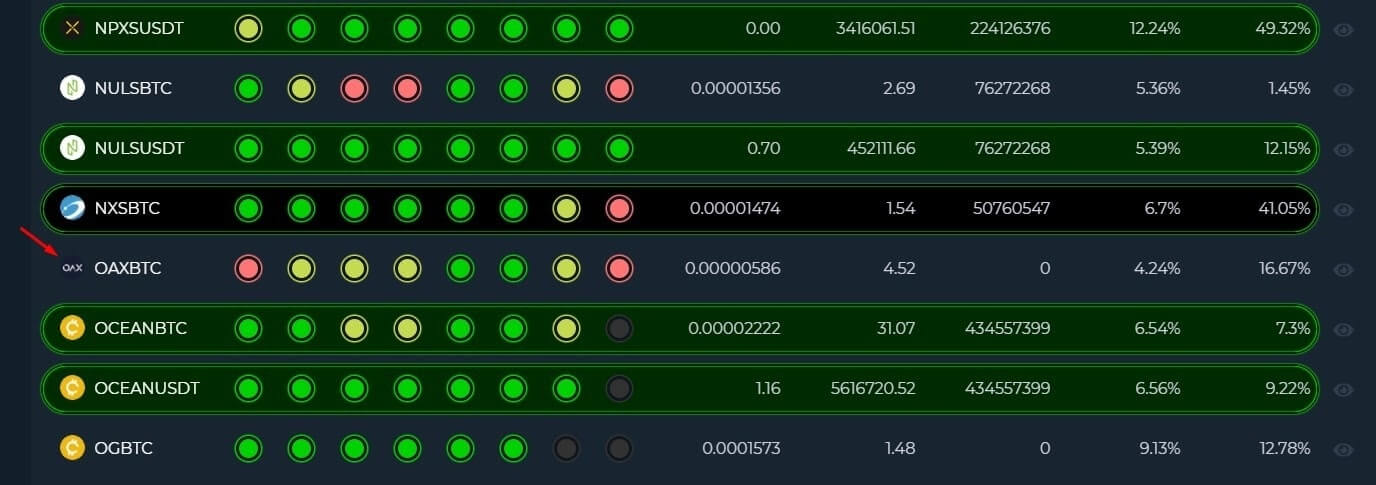
Here’s an example:

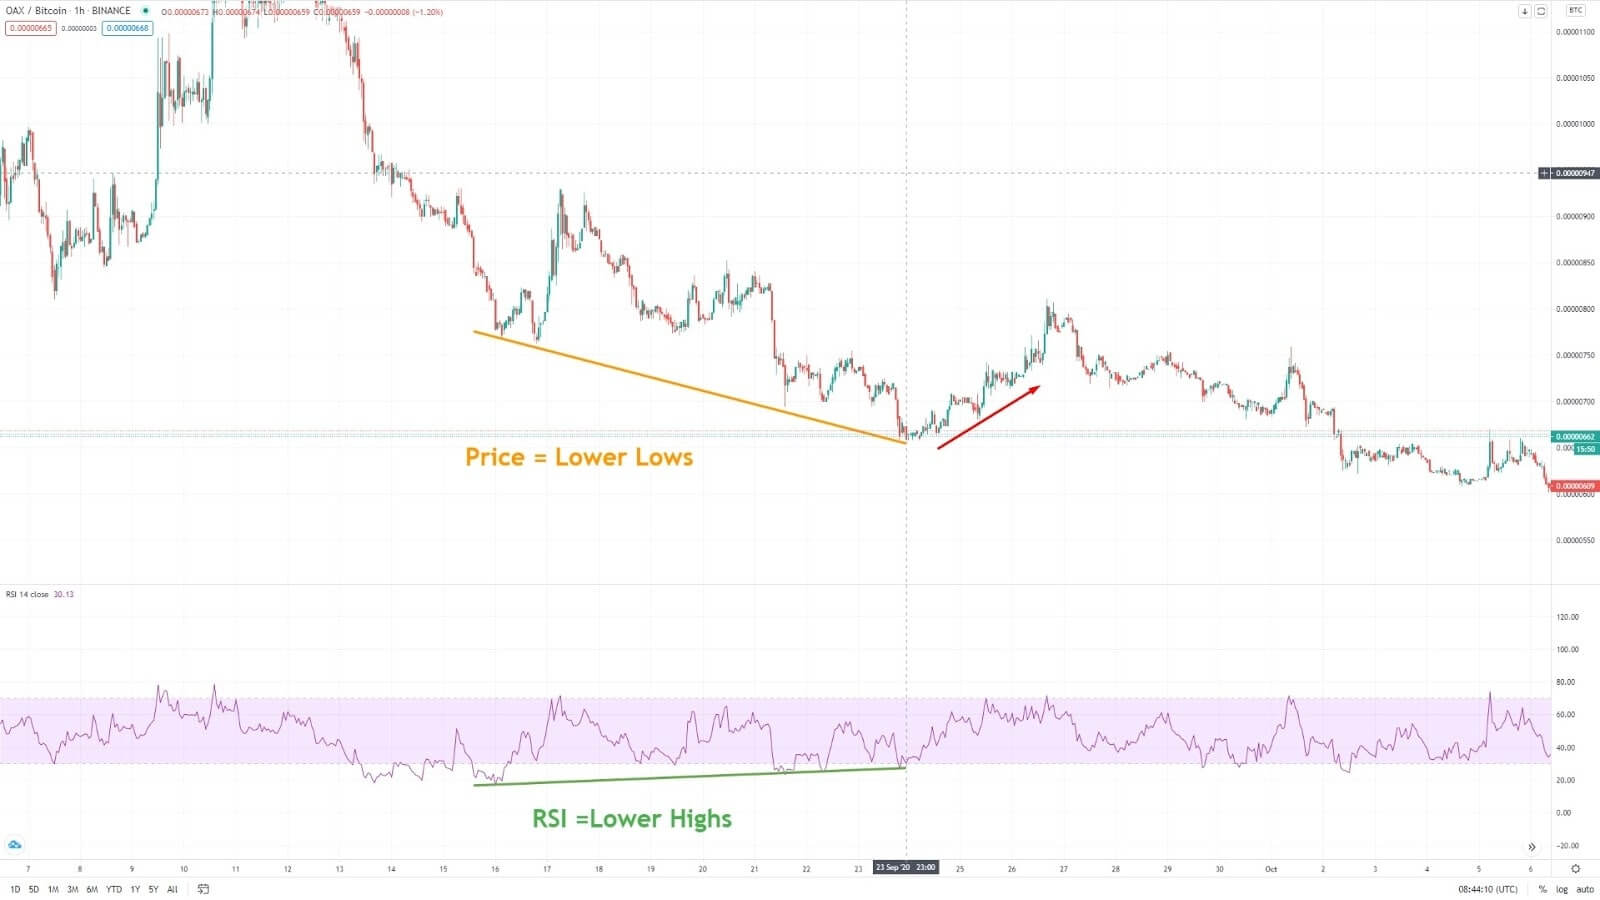
We can see that the OAXBTC has been oversold in the 5 and 15-minute time frame.
Those looking to scalp may be interested in buying OAX at this moment because there’s a good chance that a reversal is coming.
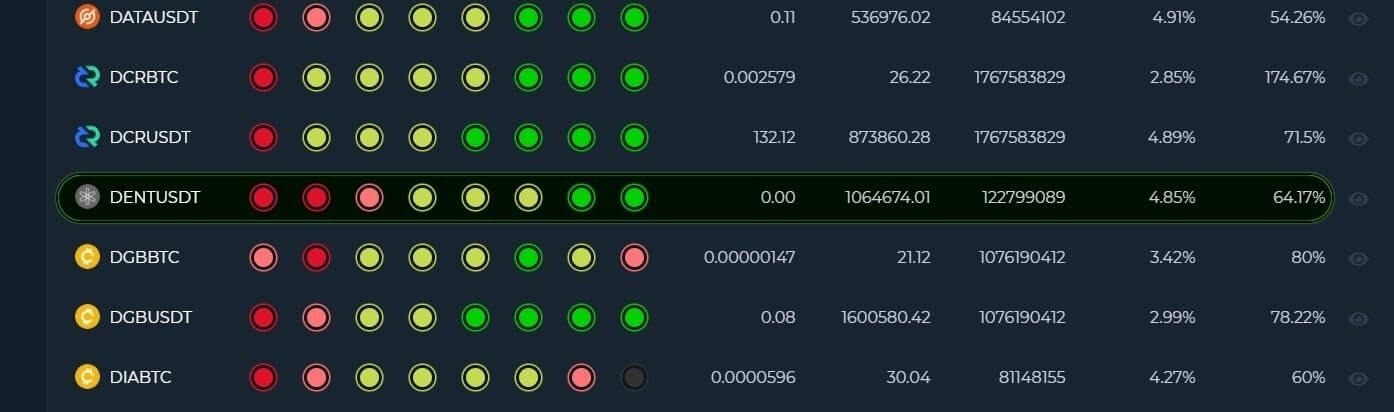
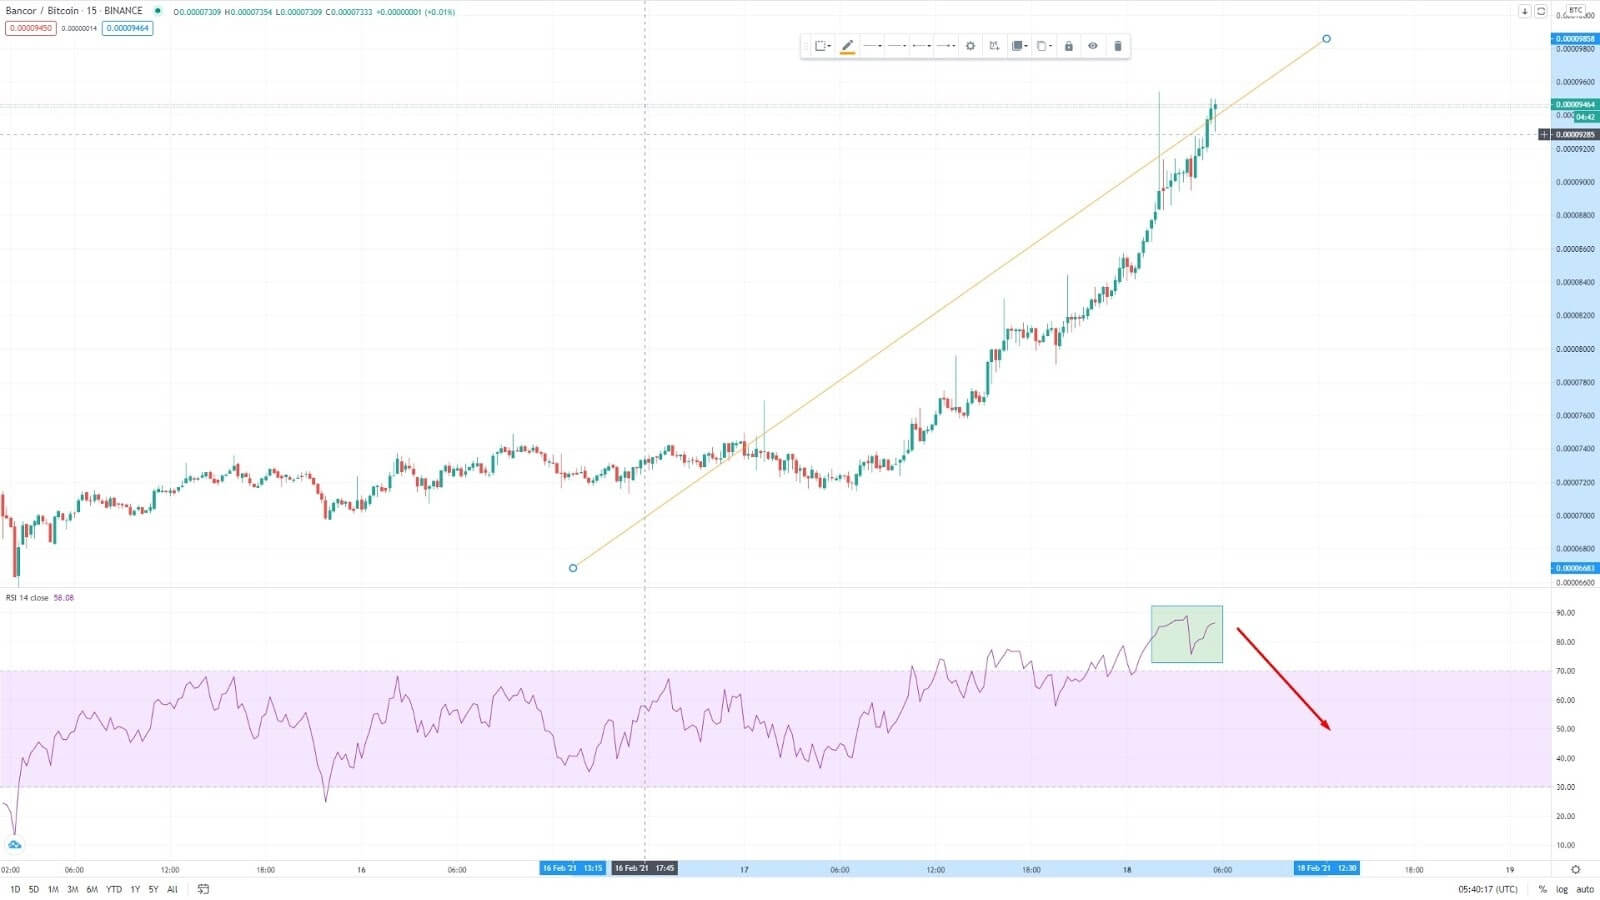
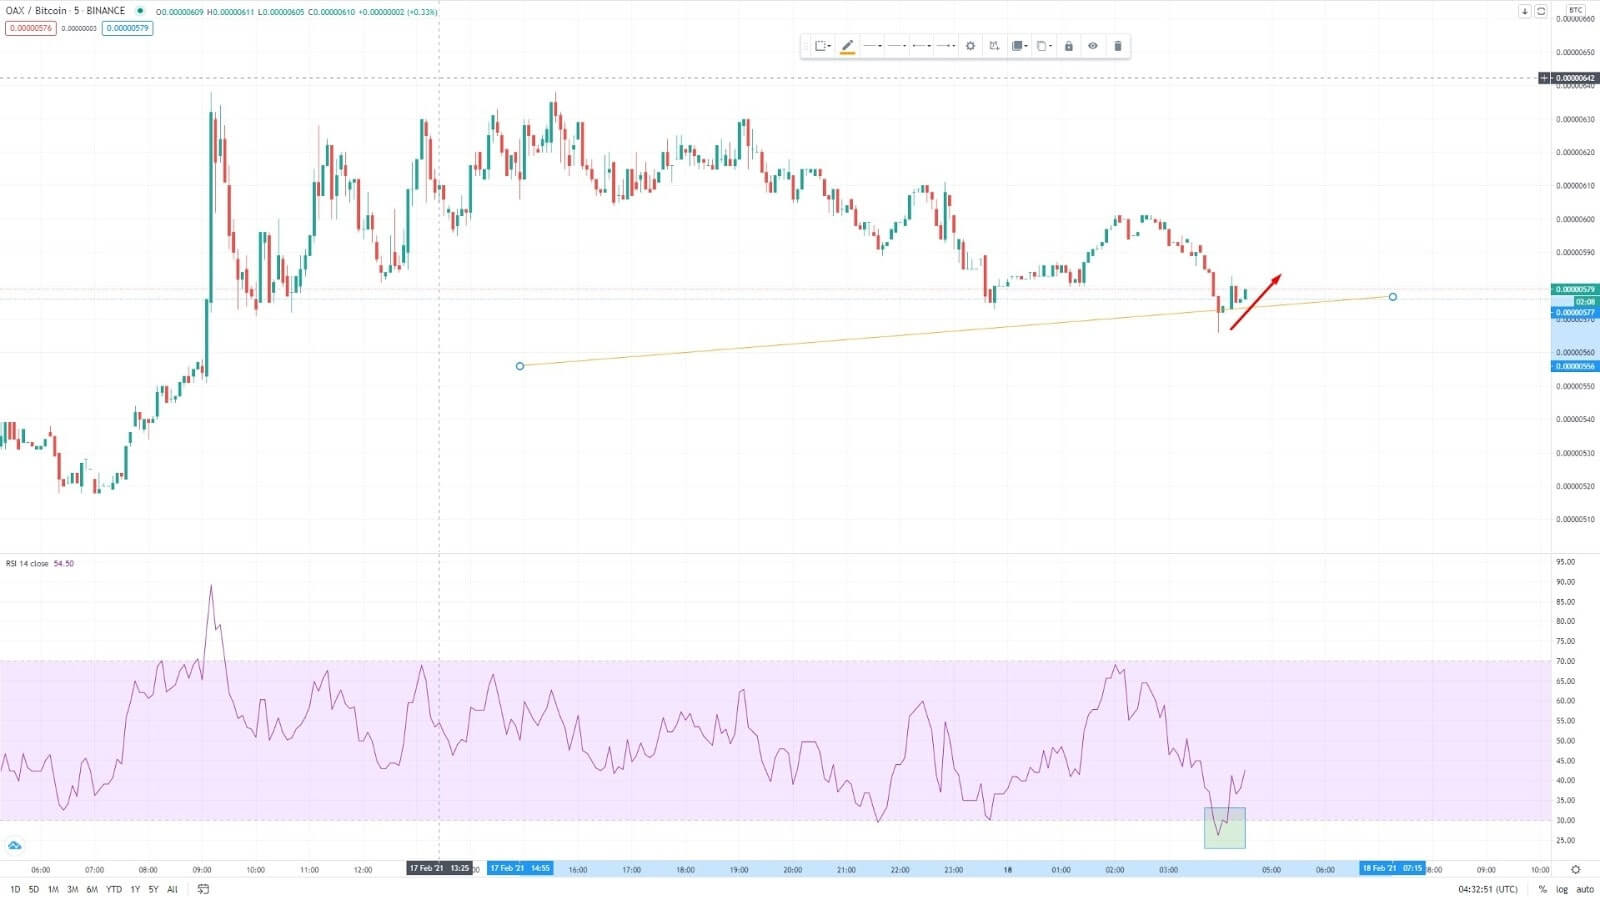
You can confirm this by looking at the Price Action Scanner (PAS) and the chart:


