Crypto Screener: Find High-Probability Trade Opportunities at a Glance With Our Price Action Scanner

Our crypto scanner analyzes more than 600 coins and highlights the most interesting price action for you. No research, analysis, or charts needed. Want to make high-probability trades? PAS does half the work for you.

ProfitFarmers Market Scanners

What is The ProfitFarmers Crypto Screener (And Why Use it?)

Candlesticks, Elliot Waves, downtrends, pivot points, support, resistance – finding winning trades is a NIGHTMARE.

Even traders with years of experience need to spend hours and hours staring at charts to make low-risk, high-ROI trades. And by the time they spot anything halfway decent, the best action is long gone…and that’s ONLY IF they get it right. Half the time they get in, they get REKT.

Price Action Scanner

Have you EVER met a happy, stable trader? Never. This is one of the reasons why.

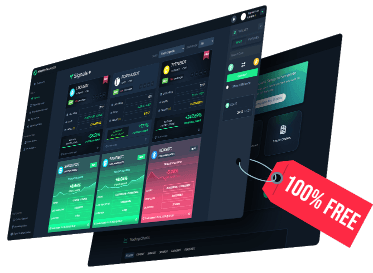
But with our crypto screener (also known as a “scanner” or “price action indicator”), half the work is already done for you. Save all that time and brain juice to make more trades…or finally sleep.

In fact, price action scanners are one of the best crypto tools for traders, since they help find the holy grail of crypto trades: Solid gains/minimal risk.

Here’s how it works…

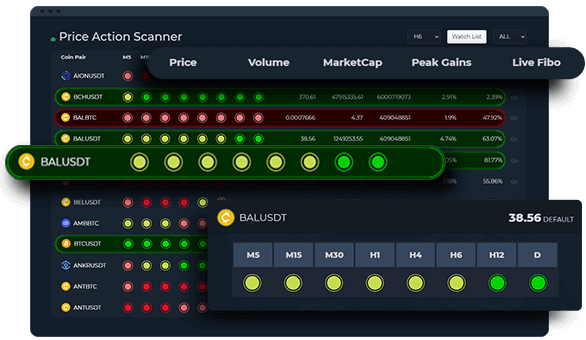
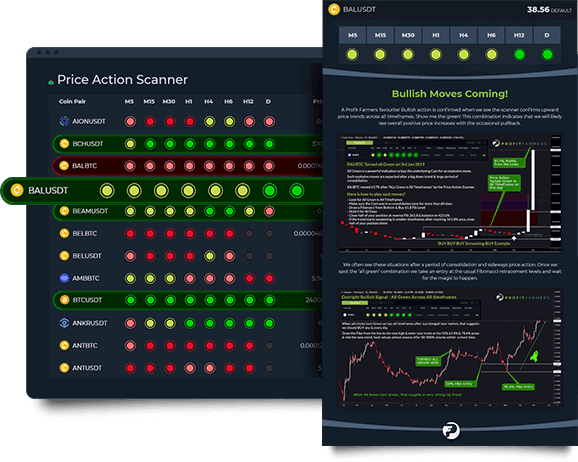
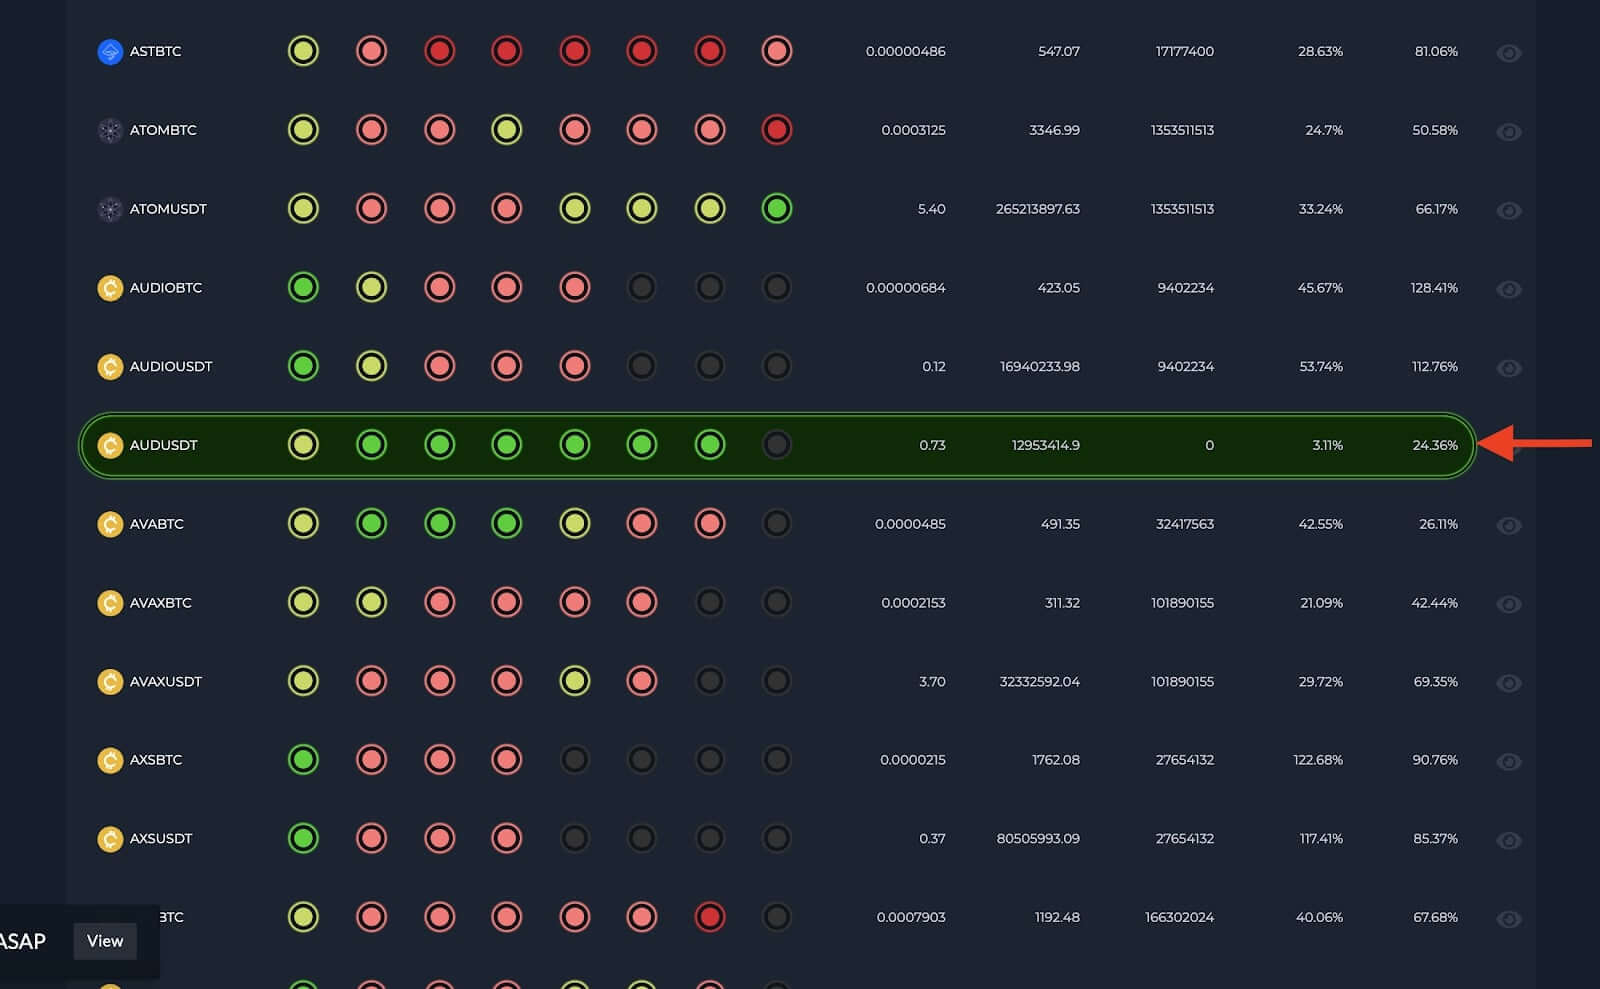
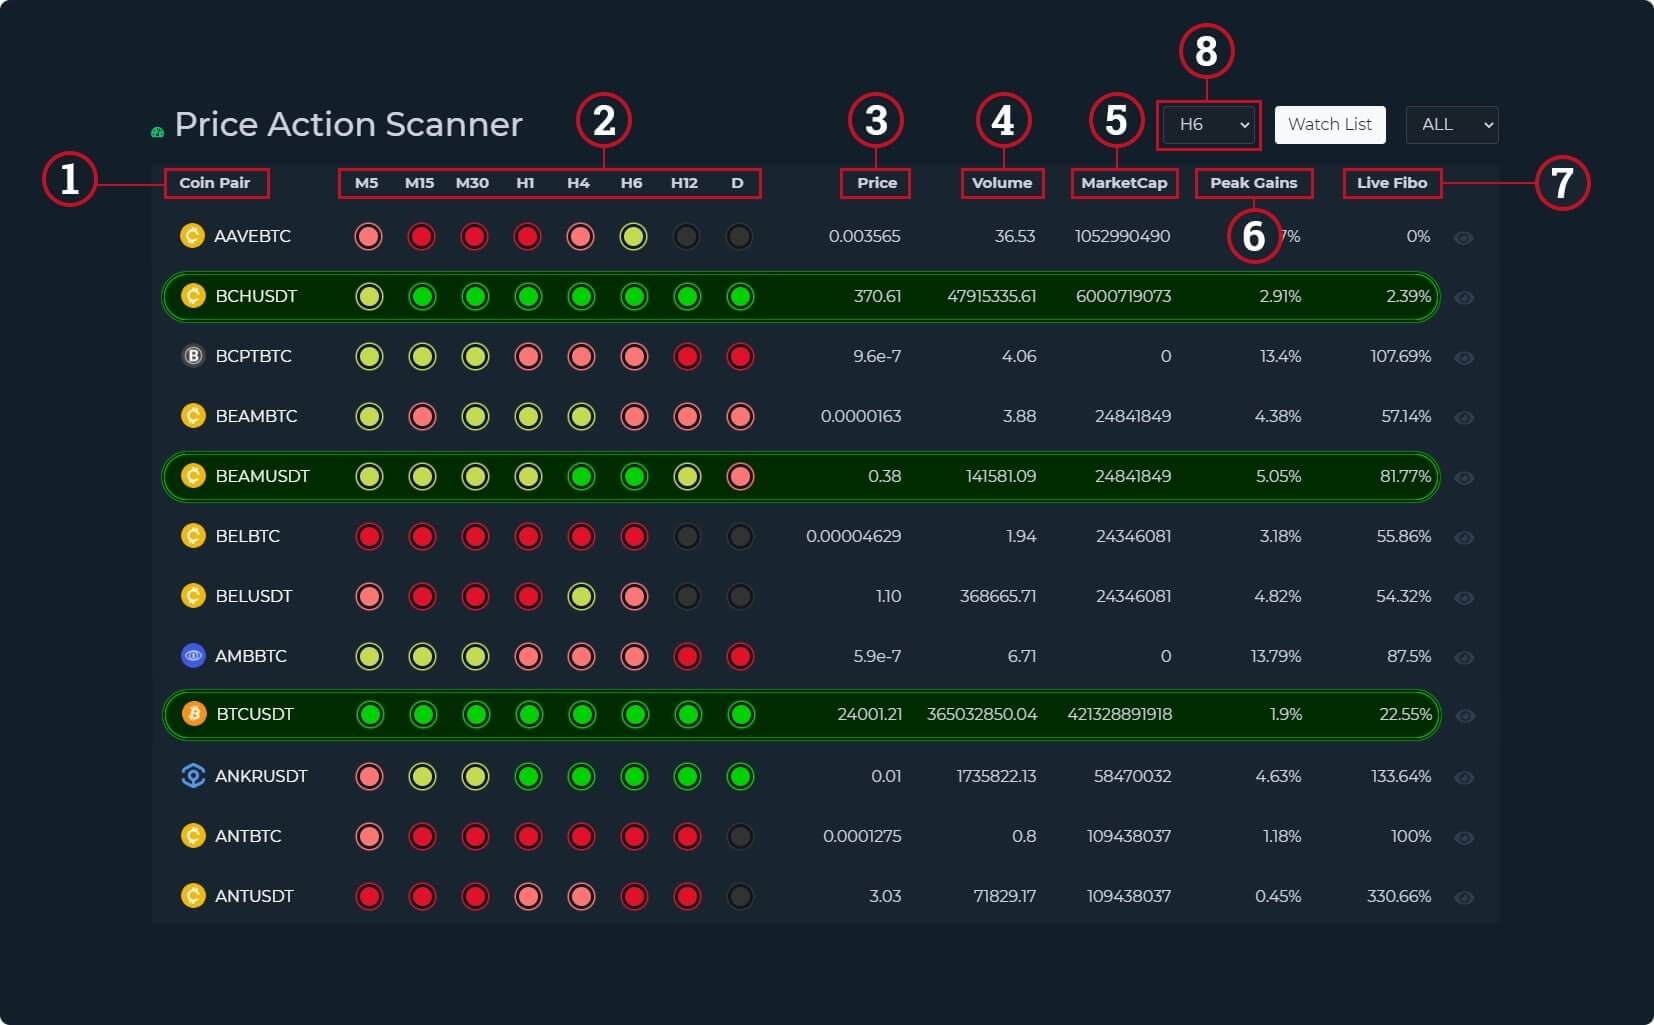
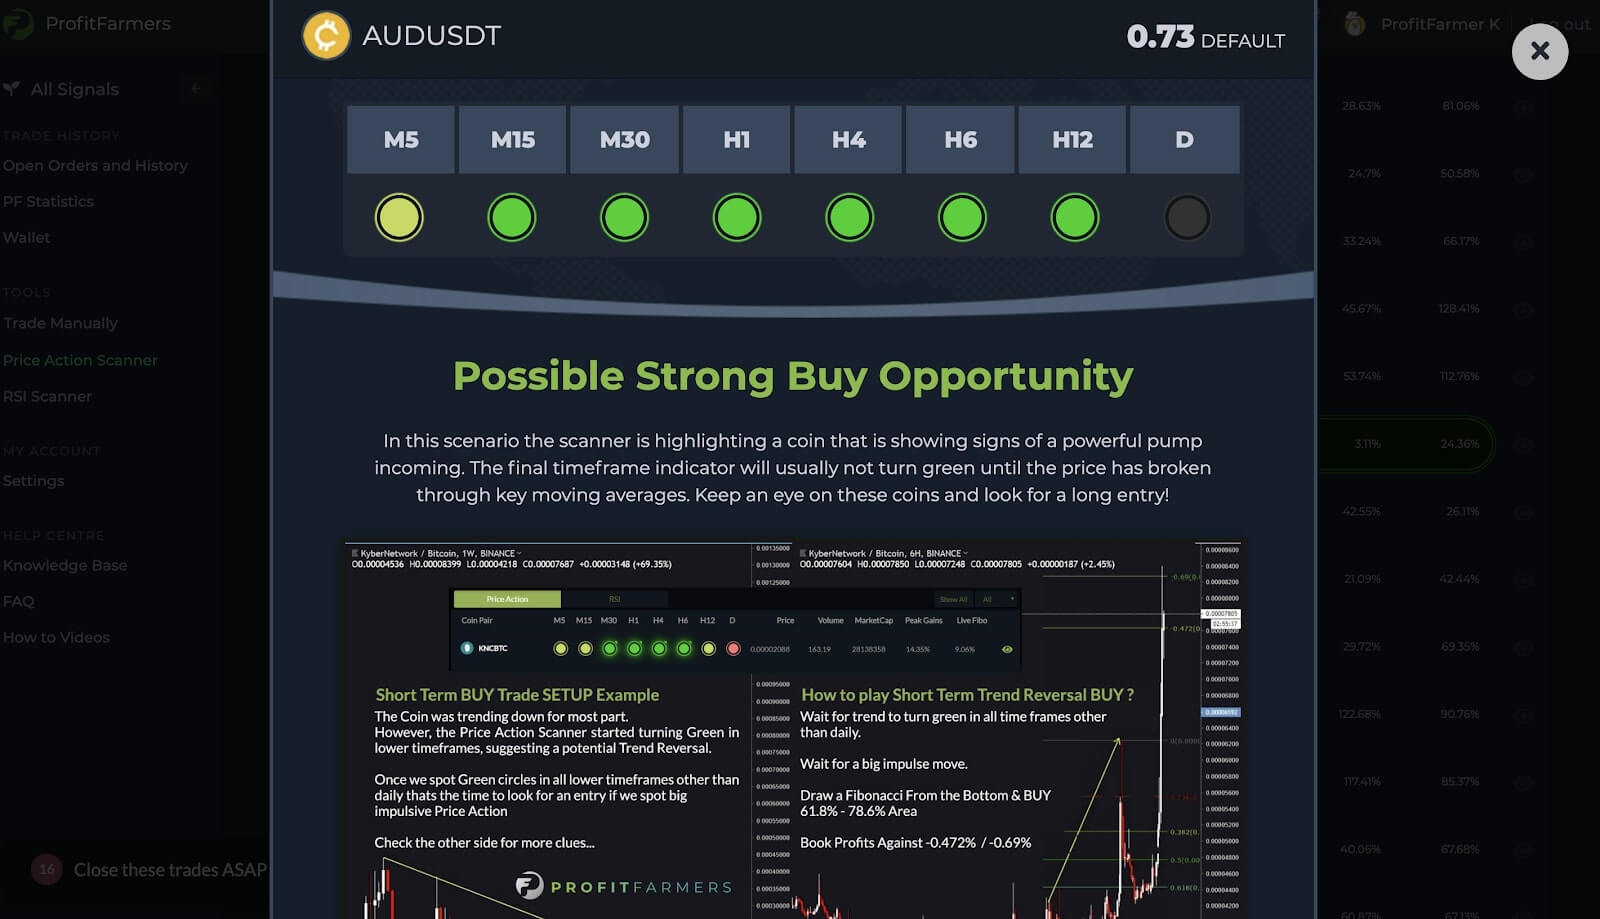
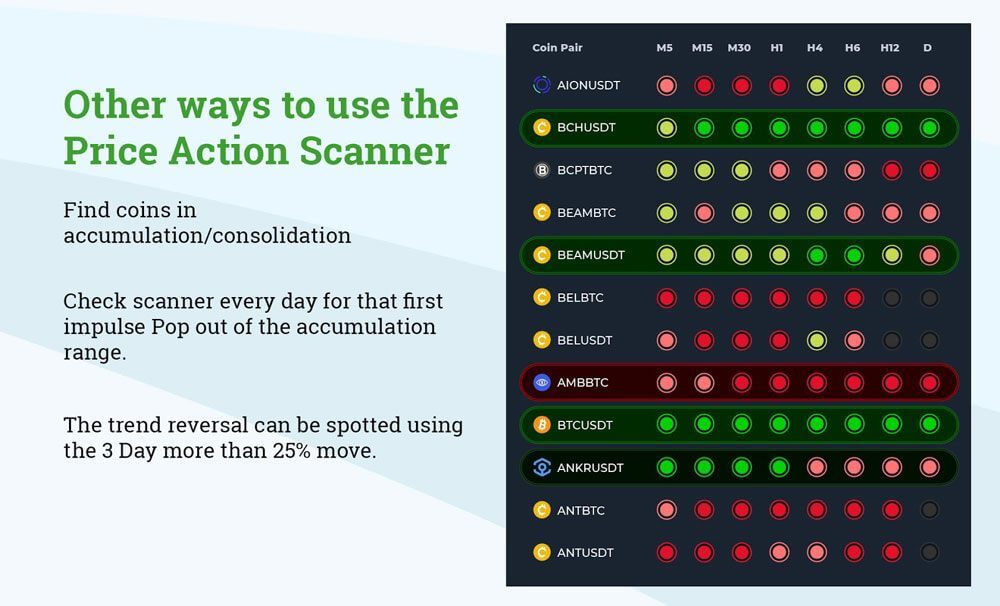
The PAS tracks Fibonacci Levels in 11 Periods & Price Trends in 8 Timeframes and displays the most interesting price action of the day in a simple, color-coded system.

This helps you spot the most interesting coin pairs out of hundreds in seconds flat. With this knowledge, skilled traders can make high-ROI and high-probability trades much faster.

In summary, a crypto screener helps you take your life back.

Benefits of Using a Crypto Scanner

Like we said before, a crypto scanner does half of the hard work for you by instantly displaying price trends in 11 different time frames.

If you know how to use this information, you can take your game to the next level:

How to Use Our Cryptocurrency Screener

If you learn to use our cryptocurrency screener right, you’ll be almost unstoppable. Especially if you learn how to combine it with our RSI scanner and your own technical analysis.

Here’s how to use this crypto screener for maximum gains:

First, What are Fibonacci Retracement Levels?

Fibonacci retracement levels are horizontal lines on a chart that predict where support and resistance levels are likely to occur.

For skilled traders, this will help spot price reversals – READ: profitable trading opportunities.

Each level is represented as a percentage.

The most popular is 38.2%, which is widely used during strong trending markets. Say the price of a coin is $1,000 and it drops by $380.20. Ladies and gents, we have hit a fibo! There’s a good chance at a reversal (but far from guaranteed).

The PAS is NOT a sure-fire indicator to magically pick out which trades are going to make you a profit. Only about half the work is done for you. The other half is still on you.

It is one of many price action indicator tools and should be used side by side with other indicators (Like our RSI scanner) to maximise the chances of you creating a winning trade plan.

Now, How Do You Use the Price Action Crypto Screener?

First off, you need to know what you are looking at. So here it is: 

  1. Coin Pair – The given coin pair
  2. Time Frames – The 8 different time frames. M stands for minute, H for hour, and D for Day. M5 is minute 5, H1 is hour 1, and so on.
  3. Price – Current price of the coin
  4. Volume – How many coins are in circulation.
  5. Market Cap – The metric that measures the relative size of a cryptocurrency.
  6. Peak gains – Potential peak gains
  7. Live Fibo – Fibonacci retracement levels at the chosen time
  8. Fibonacci calculation period – Time frame of the fibonacci retracement.
“But wait a minute” you might ask. “What's up with all the colors?”

Well, those colors are the key to making the PAS one of the most convenient trading tools out there. They identify the Price Action TREND of the coin during specific time frames.

Here is what those colors signify:

dark green

Dark green – strong up trend

Light green

Light green – sideways with bullish tone

dark red

Dark red – strong downtrend

light red

Light red – sideways with bearish tone

grey

Grey – sideways with no bias

Combinations and Highlights

PAS Highlighted
PAS open when click

Interpretation of the colored patterns is necessary to find out which coin pairs have good potential. Don’t worry though, we provide an overview analysis on the different types of color patterns to assist you.

We’ve also picked out interesting patterns by highlighting the coin pairing. Click on a highlighted coin pair to see our basic explanation of the situation the system thinks it has spotted.

If you see something highlighted in green it means it fits the criteria of one of the standard trading setups that we have configured.

Finding interesting trade ideas by using the ‘Fibos’ and Peak gains

The Fibonacci calculation period, which you have 11 to choose from, indicates where a Fibonacci retracement will be drawn to and from.

The Live Fibo is showing you the current retrace/pullback from the Peak gain within that given time period. 

For example: ‘Coin A’ moved up $1000 over the last X days. This is the peak gain. The live fibo pull back shows 75%. This means the coin has fallen back $750 (75% of $1000) and would be sitting on the 75% fibonacci if you were to draw this.

This means at a glance you can quickly spot coins that are trending and have pulled back to interesting areas where you can buy the dip or short the bounce.

An important consideration:

As said before, the tool is not a magical device that dictates the trade – you still need to get on the chart and you need to take a look at what’s happening with the price action (like knowing what happened previously to the current move).

Once you open the live charts, you’ll need to identify the moves that have already happened and think about whether a reversal is likely to happen given the trend.

A word about market cap and volume

On our PAS, we indicate the coin’s market cap and volume. This is because low market cap coins can be wildly erratic and move rapidly without volume. Hence, coins in these low marketcap areas are where the “crazy pump and dump” phenomenon usually occurs (therefore price action can be easily manipulated).

Low volume coins indicate that there is less interest in trading those coins.

So as a general rule of thumb: low marketcap coupled with low volume = very risky coins to trade.

flip-divider

Other ways to use the scanner

PAS other ways

Find coins in accumulation/consolidation and get in on the breakout

Look for coins that have been trapped in a downtrend and then a period of sideways price action.

Check the scanner each day for the first signs of an impulsive move out of the range. This can be seen earliest on the M5 and M15. If spotted, pull up the charts and look for an entry.

Trend reversal

When you see a coin that has heavily downtrended but recently bounced, a good rule of thumb is to look for a +25% gain on the 3day measurement setting.

More often than not this confirms that a trend reversal has taken place and you should look to join in with the new direction ASAP.

In conclusion,

The PAS is an effective and convenient tool for your trades which can save you time and effort by easily spotting trends. Use it alongside other indicators to maximise your chances of profit! Good luck!

Price Action Scanner (“Crypto Screener”) Summary

In conclusion,

The PAS Crypto Scanner is an effective and convenient tool that saves you time and effort by easily displaying trending price action in simple to understand colors. Use it alongside other indicators to maximise your chances of profit! Good luck!

Want To Join The Fun?

Be more profitable and start making trading work for you again.

Join ProfitFarmers and:

Scroll to Top
RESULTS-ICON OUR RESULTS

Our Results

Trading Signals Results

Results menu icon

See all the past video and blog result-breakdowns.

Recent Results

Best Trade of the Month

FEATURES-ICON FEATURES

Features

ALL IN ONE PLACE

features-hub-icon

ProfitFarmers’ tools for traders of all levels.

Key Features

ACADEMY-ICON ACADEMY

Academy

Expert Resources

Results menu icon

ProfitFarmers Free Educational Videos

What To Learn

MEMBER-ICON MEMBER STORIES

Member Stories

Member Stories

Testimonials menu icon

See our members are farming success from all around the globe

Kyne Myers

$10,000 to $35,000 in 9 Months: Kyne’s Trade Journal Shows...

Kingston Arthur - Featured img
Kingston Arthur

How ProfitFarmers Helped a Typical Family Man Grow his Account...

Hooman Attaran Featured image
Hooman Attaran

From Stocks to Betting to Pro-Trading: How Hooman Turned $5000...

Jaime Oliveira CAse Study Featured Image
Jaime Oliveira

Jaime ‘Gondola’ Oliveira How a Software Engineer Used ProfitFarmers to...

Bernhard Wagner Case Study
Bernhard Wagner

Plants $400, Harvests $8,000! How ProfitFarmers enabled a Master Gardener...

Tim Griffith - Featured Image
Tim Griffith

How ProfitFarmers helped Tim grow his trading account from $2,800...

How to use ProfitFarmers Without a Binance.com Account

The ‘how to use’ section below covers all aspects of using our platform, however, it is done so from the perspective of a Binance.com account holder. As the Crypto market has evolved, Binance.com is no longer available to everyone, as a result not all of our features are available to everyone.

We still recommend watching all of the videos in the academy but if you have trading using exchanges other than Binance.com you will need to execute your trades using the advanced trading terminal or by visiting your chosen exchange directly.

Click the button below to learn more.

CELEBRATING 2023 OF EPIC RESULTS - OVER 5,760% GAINS

REVEALED: THE NEXT
EXTREME CRYPTO CATALYST!

REVEALED: THE NEXT
EXTREME CRYPTO CATALYST!

Hey, want FREE trading signals and market updates?

79% win rate signals & expert tools, free for serious traders

Signals img