


Hey there! Welcome to the ProfitFarmers ultimate guide to crypto market cycles.
Imagine knowing – more or less – when to buy and sell cryptocurrencies. Or, at the very least, knowing which way the market was going long-term.
Market cycles are actually way simpler to grasp than you might think. And once you understand them, you’ll have a massive edge on the trading market.
The information in this blog will help you maximize gains, minimize losses, and invest way more intelligently than the average trader. There’s a ton of misinformation out there trying to scare you into buying something – ignore it.
In this ultimate guide we’ll cover:
- What market cycles are
- How they affect trading and investing
- The human psychology behind them
- Examples of bullish and bearish crypto cycles
- The different types of market cycles and how to approach them for maximum gains
So close all your other tabs, pause those GURU YouTube tutorials, and pour a coffee, because we’re about to take a deep dive.

What Are Crypto Market Cycles?
Crypto market cycles are the natural rise and fall of crypto asset prices due to trading fundamentals, human emotion, and market conditions.
They are the repeating pattern of rise, peak, fall, bottom, and rise again that happen over and over again across asset classes. Humans and market mechanics create this cycle of boom-and-bust everywhere from crypto, to housing, to stocks, to tulips, and beyond.
Cycles do not happen linearly. Nothing goes straight up and then straight down. There are long-term cycles, short-term cycles, weekly cycles, daily cycles, cycles within cycles…you get the picture. However, on a macro scale, it’s clear that the price of assets like Bitcoin ebb and flow from peak to bottom.
It’s really just nature, isn’t it? What goes up must come down. Tides go in – tides go out. Sun comes up – sun goes down.
Crypto Markets Explained: The 4 Phases of a Market Cycle
Crypto markets, at their simplest, behave like this:
Phase 1) Accumulation
The price is at its lowest and smart money begins to buy in expecting the price to rise. This is the start of a new cycle.
In the case of new projects – for example, an altcoin – this could be the start of one or the point at which it has bottomed out after peaking.
Phase 2) Rise (Bull Market)
The market direction is clear. It’s bull run time. Smart money is already in, but more and more people “in the know” start getting in as the price is certain to keep rising at an increasing rate.
FOMO sets in as headlines keep hyping Bitcoin up. Talks of “$500,000 Bitcoin?” and “100x gains?” dominate the media, enticing tens of thousands of people to throw money at BTC hoping to get rich.
Phase 3) Plateau
The bull run is over and prices chill out at the top. Simple as that. Sometimes you’ll see a violent sell off, oftentimes you’ll get a ‘double top’.
Phase 4) Fall (Bear Market)
What goes up must come down. Prices now begin to fall as more and more investors sell off their Bitcoin. Denial gives way to panic, eventually sending prices falling at ever increasing rates.
This is a very simplified version – and crypto can go literally BATS*** crazy at any time – but this is more or less how it works.
Here’s a more complex version of how most cryptocurrency cycles look:
- Accumulation: This is the beginning of the run up. Smart traders, whales, institutions, and people in the know begin to get in. Basically, this is people who understand crypto cycles buying at what they believe to be the lowest point expecting the price to reverse.
- Rise: The price slowly begins to creep up. The web is full of “Bitcoin price prediction!” and “next bull run coming?” posts from gurus.
- Price rises even quicker: People start to realize it’s real and buy back in. Those who bought in low begin to take profits. The thrill of the bull run starts to take over and everyone FOMOs and YOLOs money into Bitcoin.
- Plateau: Sellers begin to dominate and distribute BTC to whoever is willing to buy. The price will plateau as sentiment begins to mix. This could last days, weeks, even months.
- The price begins to fall: As the price begins to fall, some will be in denial while smart traders will sell.
- Prices fall rapidly: Panic takes over. Everyone starts jumping on lifeboats, but there aren’t enough for everyone.
- Bottom: The price ping-pongs around near the bottom until it finds a comfortable resting place. This is the lowest range the coin will go before repeating the process. Smart money begins to accumulate again.
Repeat.
Again, this is a very simple overview and none of this happens linearly.
Market cycles can even be divided up further into different directional biases. Knowing which area of the cycle we’re in and the directional bias will help you further maximize gains by providing more granular incites into probable price action.
Let’s dig a little deeper.
Crypto Market Cycles Explained: The 5 Types of Directional Biases
Crypto cycles are like onions: There’s the big outer shell, and then there’s all those smaller, smellier layers you need to peel away if you want the best stuff.
Pretend trading was like cooking – if you try to cook with the outer shell, you’re screwed. Peel away the layers and cook with the inside stuff, and you’re halfway to a good recipe (note, I’m clearly a terrible chef).
What we mean is that if you really want to trade/invest like a pro trader, you need to do even deeper analysis into market cycles and know what to do in each section of the cycle.
Remember, there are long-term cycles, short-term cycles and cycles within cycles. You need to think about the bigger picture while analyzing the smaller one simultaneously.
OK, still with me?
Within each larger cycle, there are 5 smaller cycles that we refer to as “biases”.
There are 5:
- Strongly Bullish
- Strongly Bearish
- Small Range Sideways
- Medium Range Sideways
- Big Range Sideways
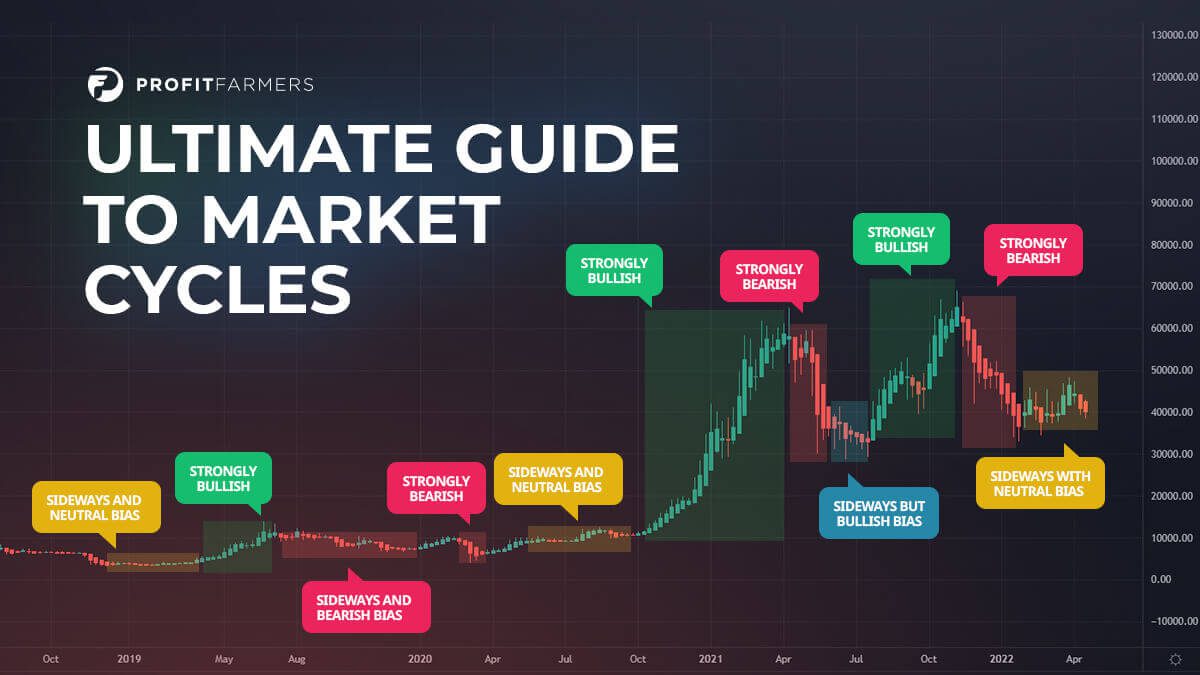
Here’s a chart to simplify things:
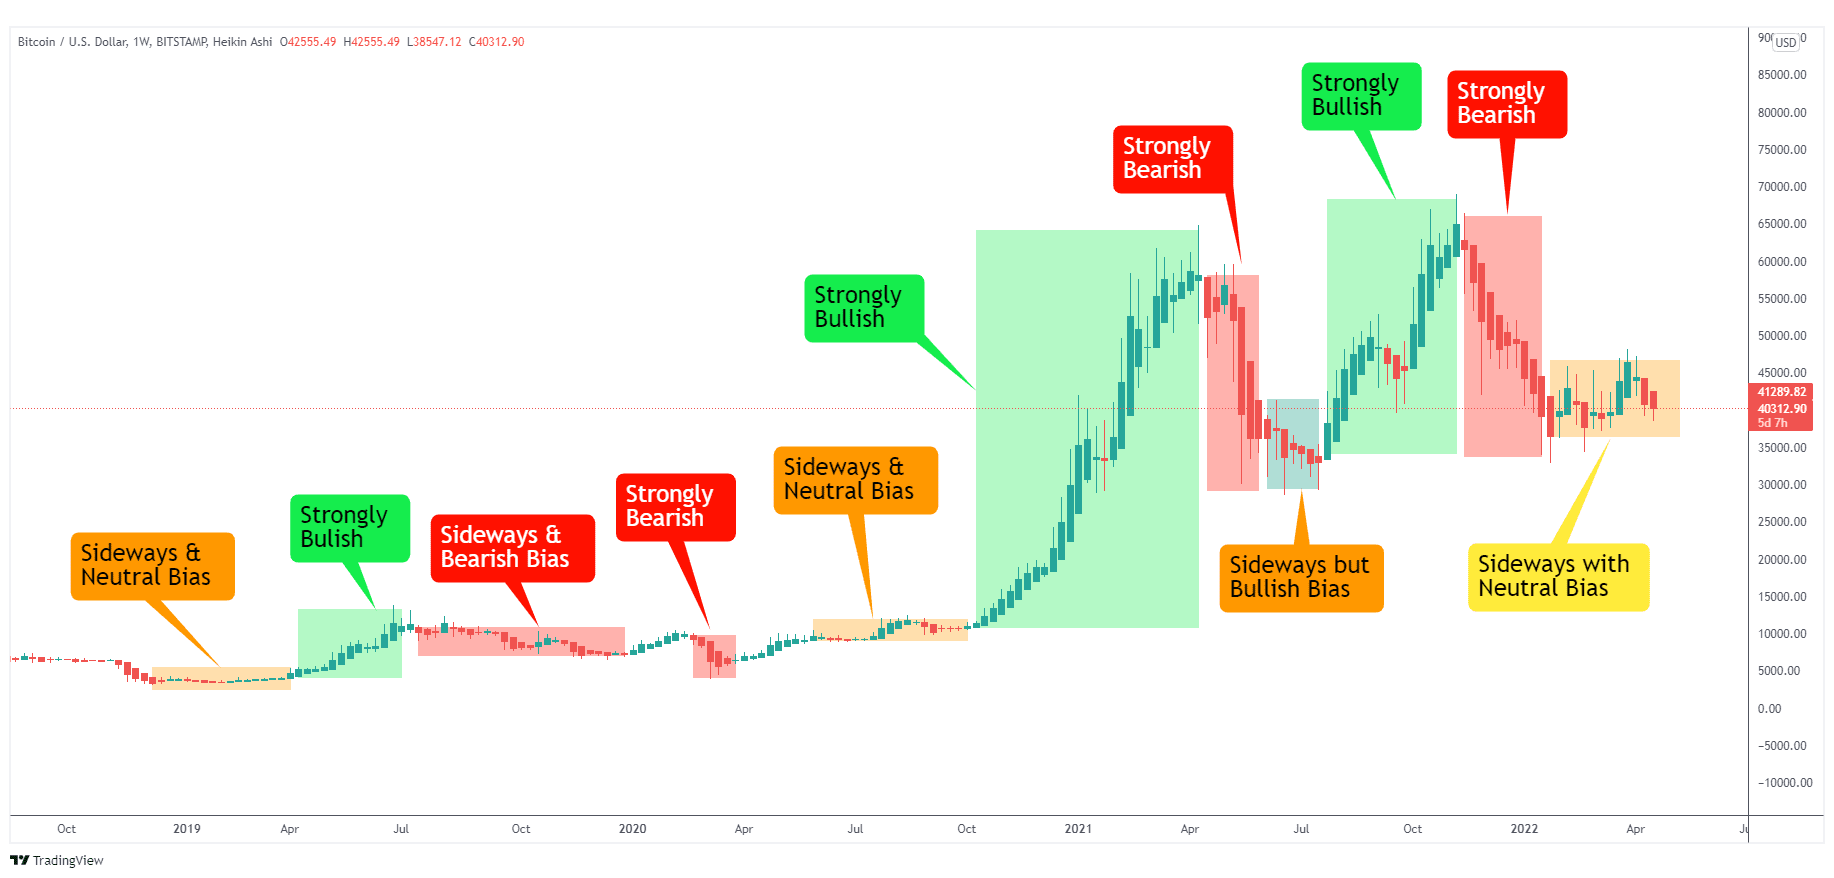
Pretty simple, right? It’s all basic concepts you’re probably already familiar with. Bullish means things are going up, bearish means they’re going down, sideways means…well…sideways.
But as you can see, even sideways “ranging” biases have their own hues. They can be neutral or slightly bullish/bearish. Markets, for the most part, are usually sideways with a certain tint until trends break out.
Let’s cover how you should behave within each of these trends.
Strongly Bullish
The rush is on. This is Wolf of Wall Street type stuff now. Buy anything and everything you can get your greedy hands on.
Prices tend to trend upwards relentlessly, just with small dips. This can last for days, weeks, months, or even years.
For example, Bitcoin was in a strong Bullish market throughout 2017 on its meteoric rise from ~$700 to $20,000.
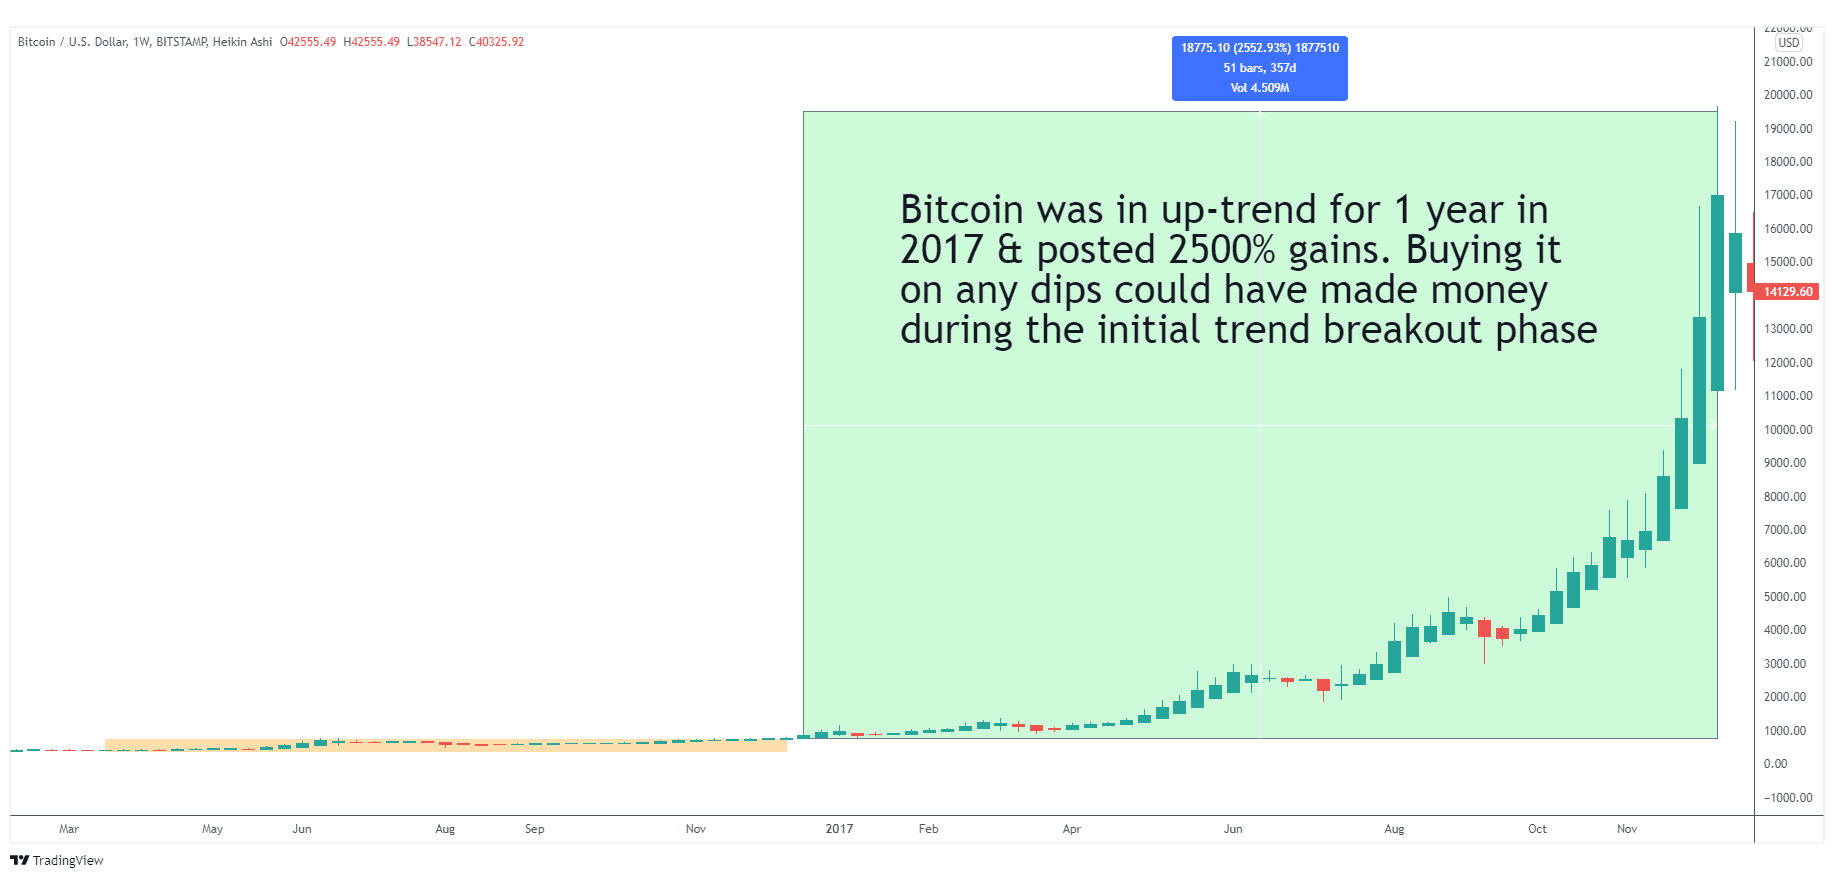
Buying in at the beginning, then again on dips could’ve made you insane profits by riding the wave. $700 to $20,000 is more than 2,000% gains.
Strongly Bearish
This is the free fall from grace. An asset has risen in price, plateaued, and now starts to fall. Panic often takes over as emotional beings sell off everything before it’s too late.
Here’s an example of an ETH bear market. After posting an all-time high of $1,400, ETH entered a strongly bearish market for an entire year in which it lost 95% of its value.

Your goal here is to filter out strongly downtrending coins, and avoid trading them at all costs. It’s simply not worth it.
Here at ProfitFarmers, we filter out downtrending coins, because trading during downtrending momentum could end up in disaster.
Randing/Sideways
Sideways markets are the norm. If things were either bullish or bearish at all times, there’d be chaos. These are the eye of the storm.
Prices ping-pong around – sometimes for months on end prodding the edges looking for a way to break out or break down.
But there are even biases for ranging markets that could give you clues as to whether or not a bull or bear market is coming next.
Let’s break them down one by one:
Sideways Neutral
About as boring as it gets in trading. Sideways neutral ranges (“consolidation” ranges) are when prices consolidate in a narrow range.
On a chart, it basically looks like a straight line with a few bumps here and there.
Here’s an example using AMD stock:

AMD was stuck in an 18% range for nearly 100 days, bouncing up and down in a give and take battle to either break out or break down.
Note that there’s no bias towards up or down – the prices touch the bottom as often as the top.
Sideways Bullish
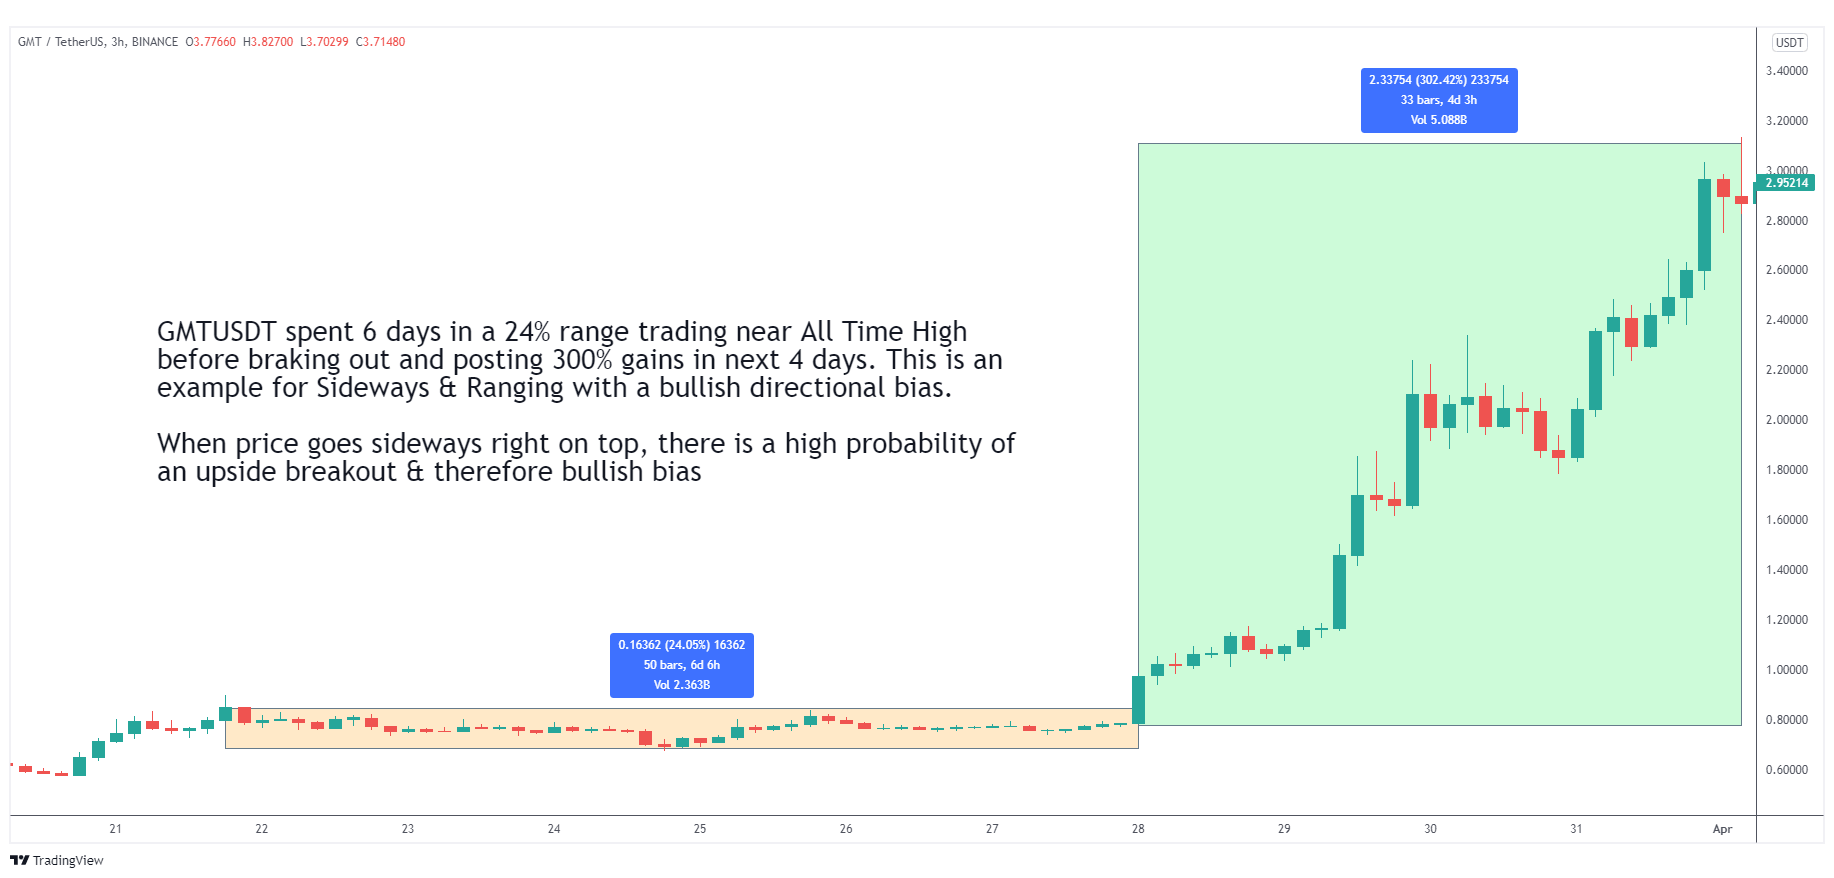
Sideways bullish is when a price is hovering in a range but with a bullish undertone. Note that it stays towards the higher end of the range, only touching bottom once.
After 6 days in a 24% range near the all-time high, it broke out and posted 300% gains in the next 4 days.
When markets are sideways bullish, there’s a high probability of a breakout.
Sideways Bearish
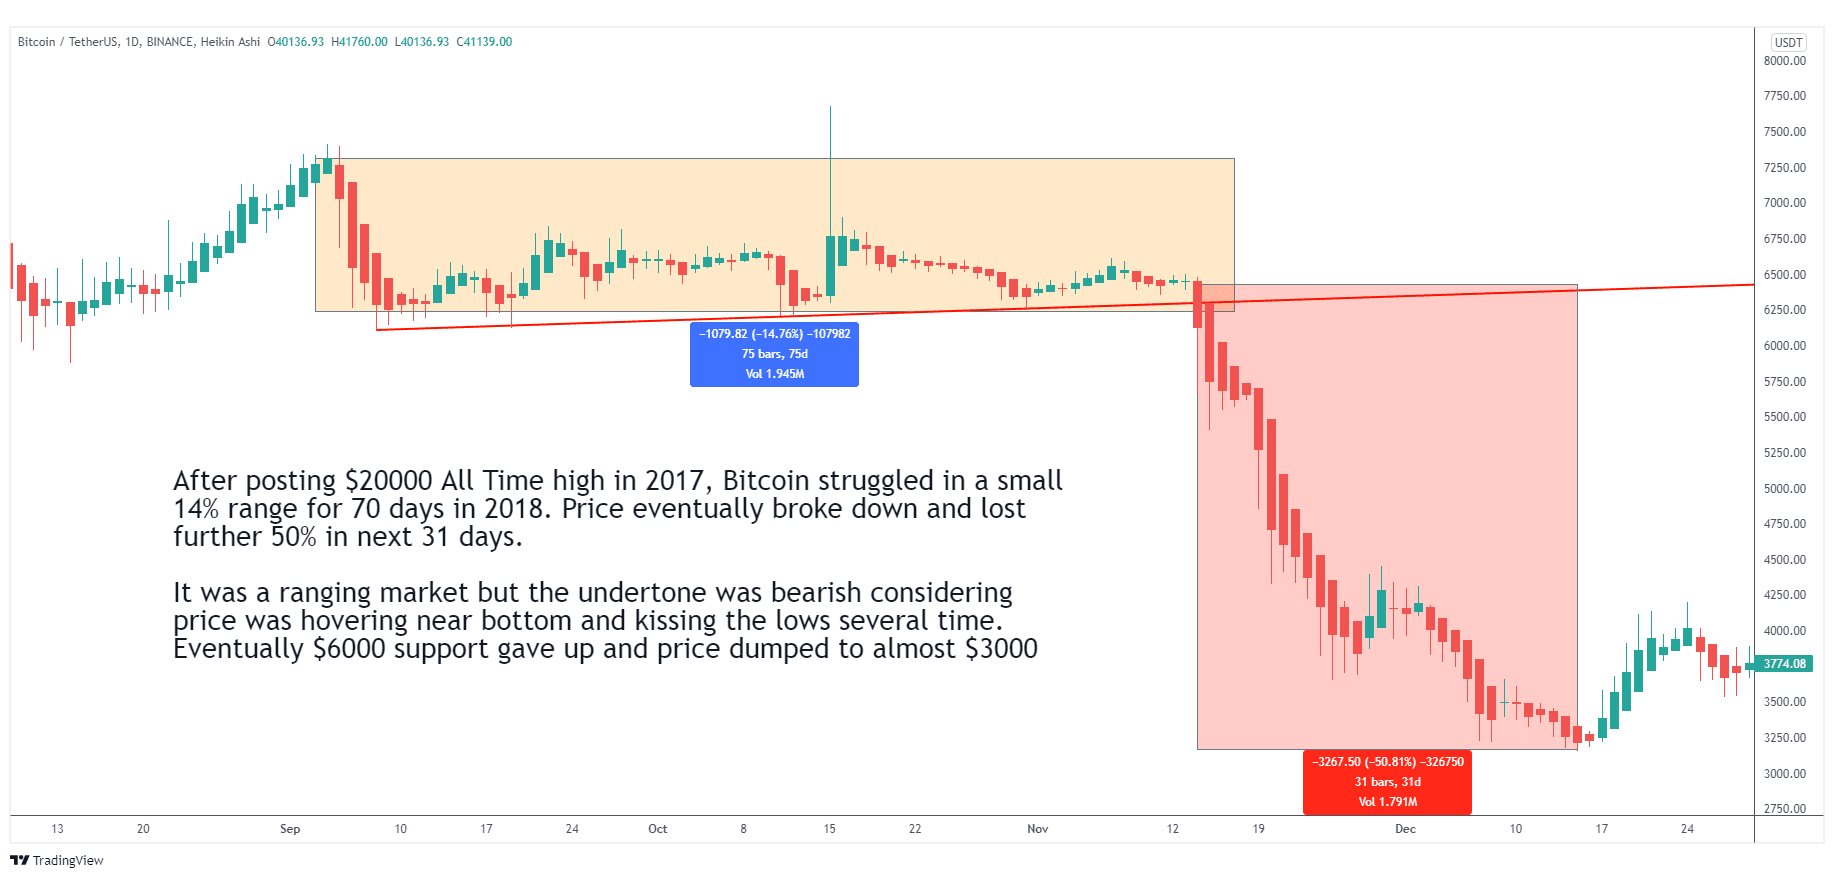
After posting $20,000 All Time high in 2017, Bitcoin struggled in a small 14% range for 70 days in 2018. Here is a clear example of a sideways bearish tone.
This means the market is in a range but favoring the bottom of the range. Notice here how BTC kept kissing the low – or near it – several times before breaking down and eventually losing 50% in the next month.
Eventually $6000 support gave way and the price dumped to almost $3000.
#REKT.
A Note about Closed Early Trades
You’ll find that we close a lot more trades early during bearish market cycles. The reason for this is simple – Bear markets are much more choppy and unpredictable. Trends fail to continue and false breakouts are commonplace.
Traps are everywhere.
Experienced traders can navigate these conditions and still make money but novice traders often fall prey to their own boredom and frustration.
The number one priority during bearish cycles should be survival and protection of your trading balance. You need to save your ammunition for firing off in the best conditions.
Bearish cycles include bullish mini-cycles so we still find plenty of opportunities and trading counter-trending coins has become something of a speciality for our team.
So don’t get us wrong, you can still make plenty of money in bearish markets, it’s just a different playing field and expectations as well as your strategy should be adjusted accordingly.
If you choose to trade, make sure you’re doing so with the expectation of needing to close early and take minor losses here and there.
You can read more about this topic in our guide: How to trade bearish market cycles and choppy price action.
Crypto Market Cycles Key Takeaways
- Understand that all markets boom and bust, it’s nature
- Crypto is very volatile, but it also has long-term and short-term cycles
- Understanding and embracing market cycles can maximize your gains and minimize your losses. It can also eliminate overly emotional decisions
- Bull markets are where the money is, avoid over trading in bear markets if possible
- There are cycles within cycles. Learn them - Strong bullish, strong bearish, and small, medium, and big range sideways
- Breakouts after sideways bullish ranges are the fastest money in short periods of time
- Avoid strong bearish markets. This is almost always a huge loss. Wait for the bottom to form and for reversal cues to present themselves
- Buying purely based on support/resistance levels is not a viable strategy long-term. You must see the bigger picture.
F.A.Q
Q: How long are crypto market cycles?
A: It’s impossible to say how long crypto market cycles are.
They could be days, weeks, months, or even years. Some crypto market cycles are years long.
Others are over and done in just a few days before repeating. It’s impossible to say.
Q: Crypto bull vs crypto bear market cycles. What’s the difference?
A: Crypto bull markets are when the price is rising steadily long-term with regular dips.
Crypto bear market cycles are when the price is falling long-term.
In general, you want to avoid investing or trading in strong bearish markets (unless you are a good Short Trader).
Q: What are the market cycles of Bitcoin?
A: The cycles of Bitcoin are the same as every other market cycle: Accumulation, rise, plateau, and fall.
These can be further divided into smaller cycles such as greed, disbelief, distribution, and panic. But at the very basic level, there are 4 phases of a crypto cycle.
Q: How long are Bitcoin cycles?
A: It’s impossible to say how long Bitcoin cycles are. However, since Bitcoin is more stable than altcoins, general rules apply to BTC that might not apply to other coins.
Still, it’s impossible to say how long a cycle will last. It could be months or even years.


