


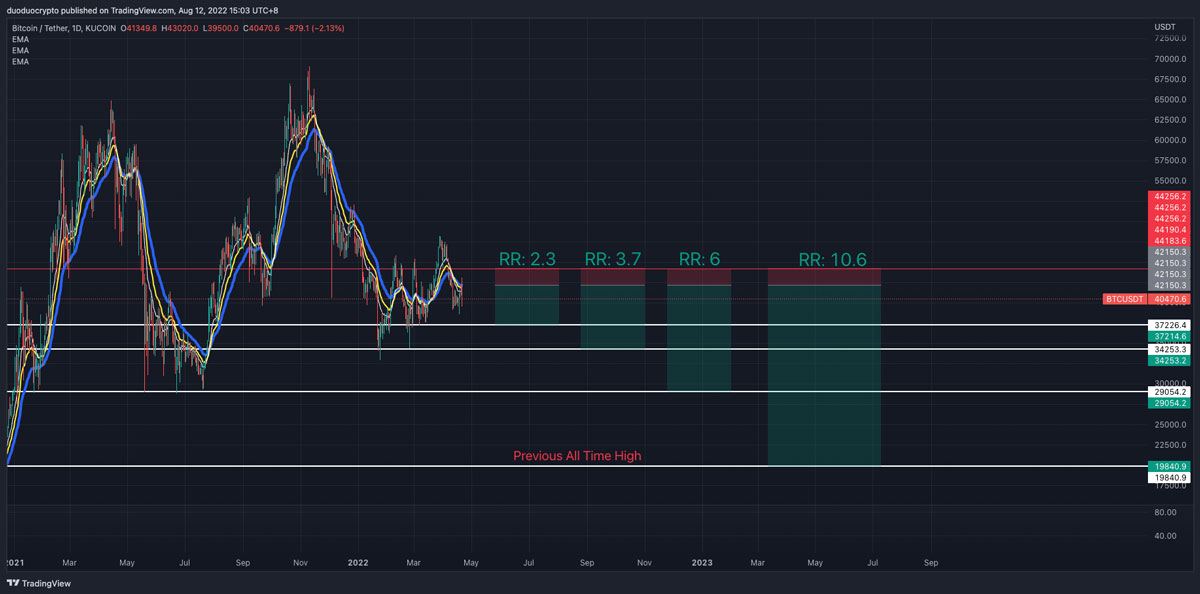
Think of it as paying $500 for the opportunity to make a profit of $1150.
The same logic applies to the other targets.
At TP 2 you stand to gain $1,850
At TP 3 you stand to gain $3,000
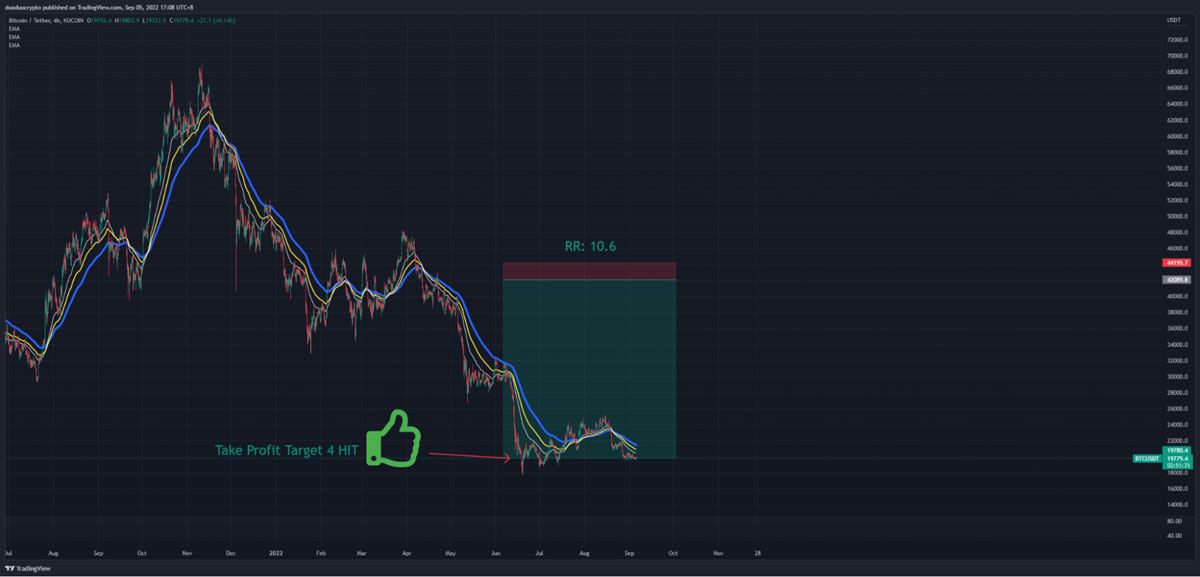
At TP 4 you stand to gain $5,300
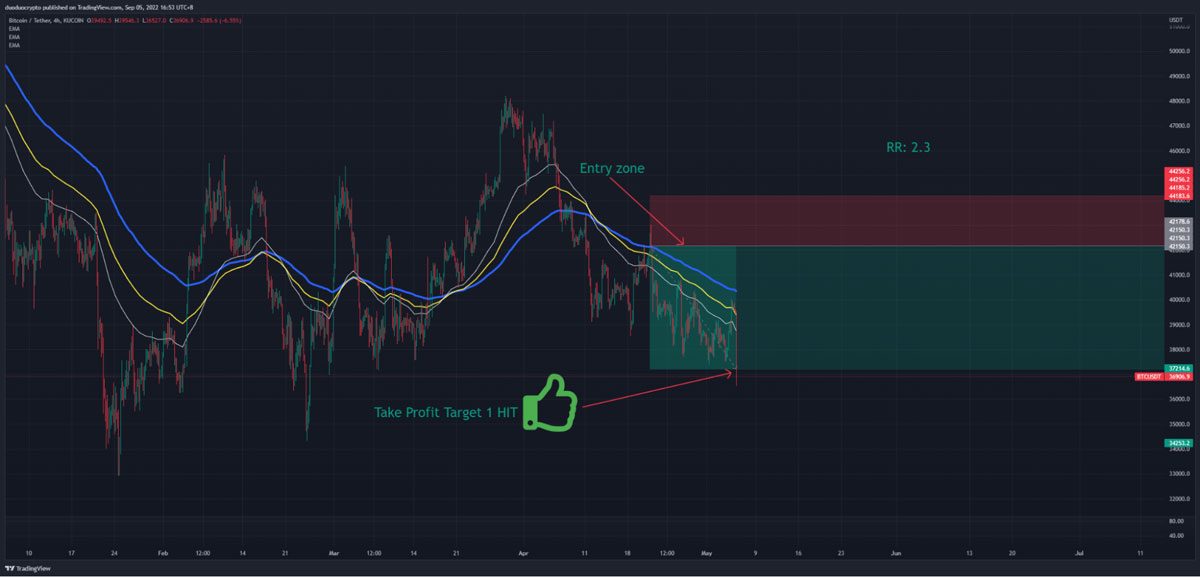
To keep things simple, in our example you aimed for Target 1, as a 2.3 RR ratio is a decent enough trading plan.
- Execute your plan
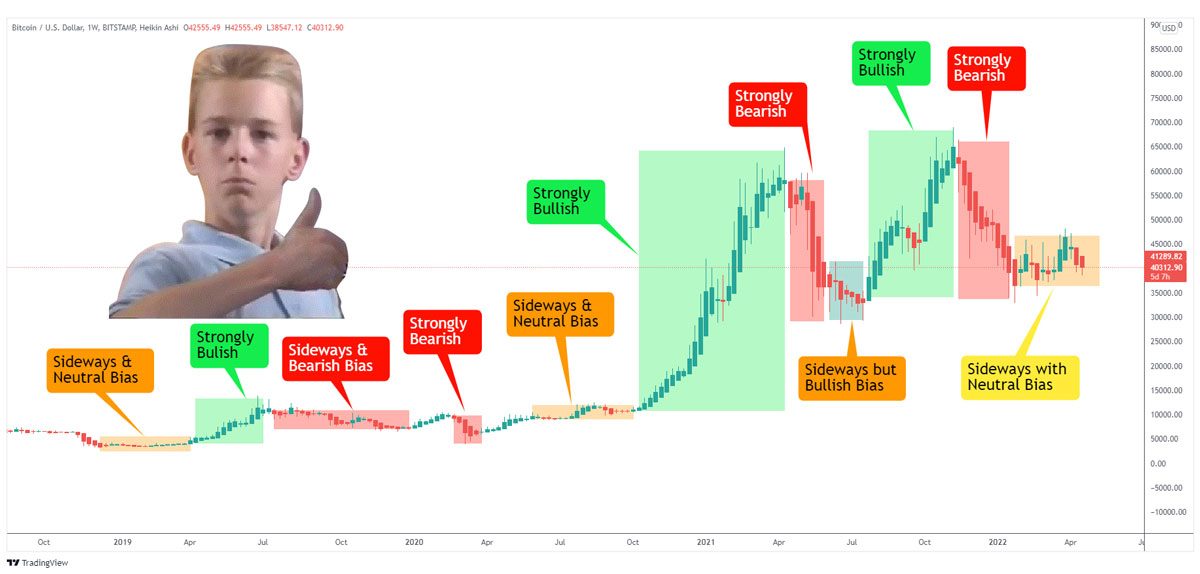
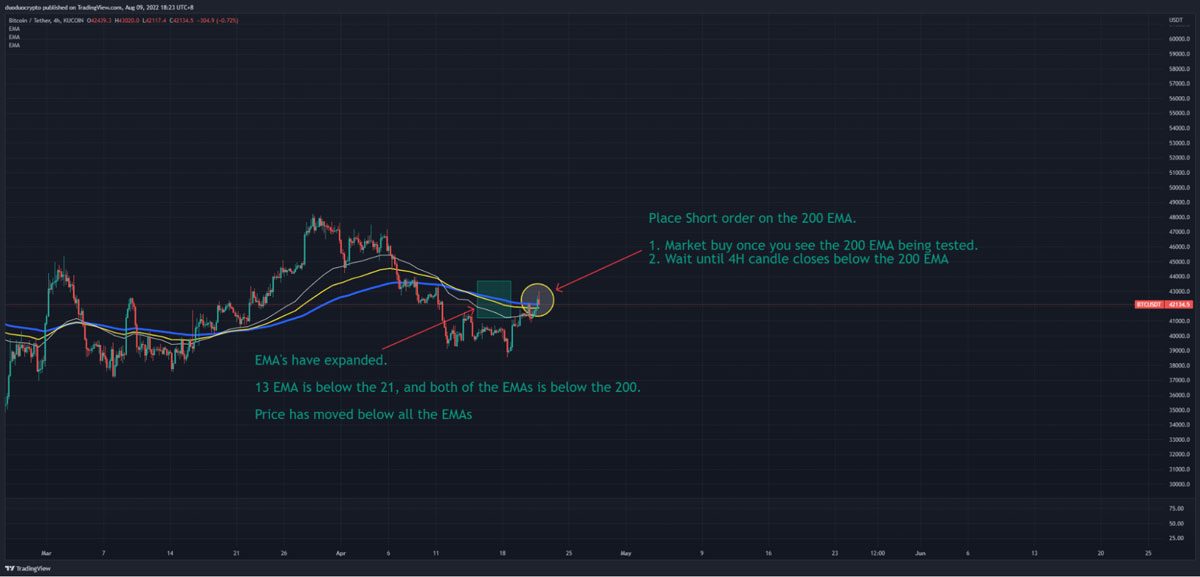
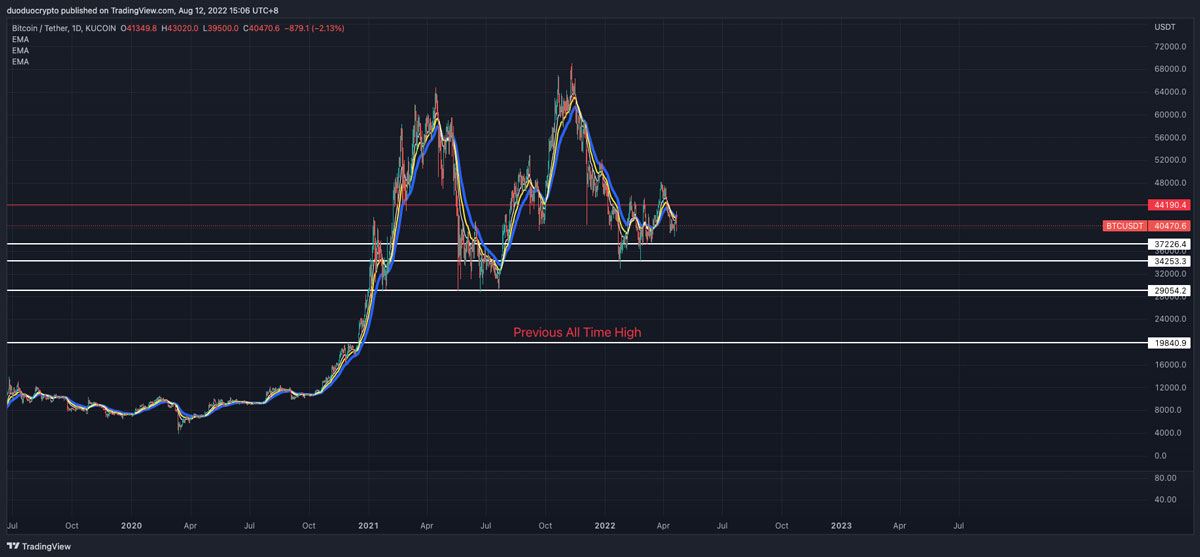
The Bitcoin short trading plan
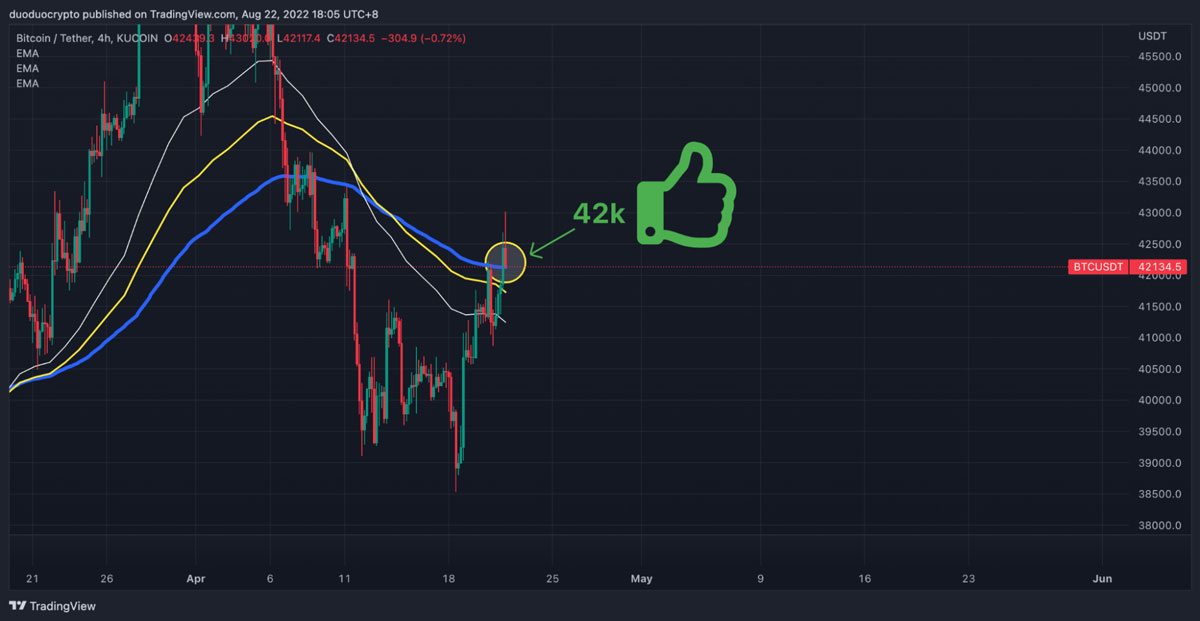
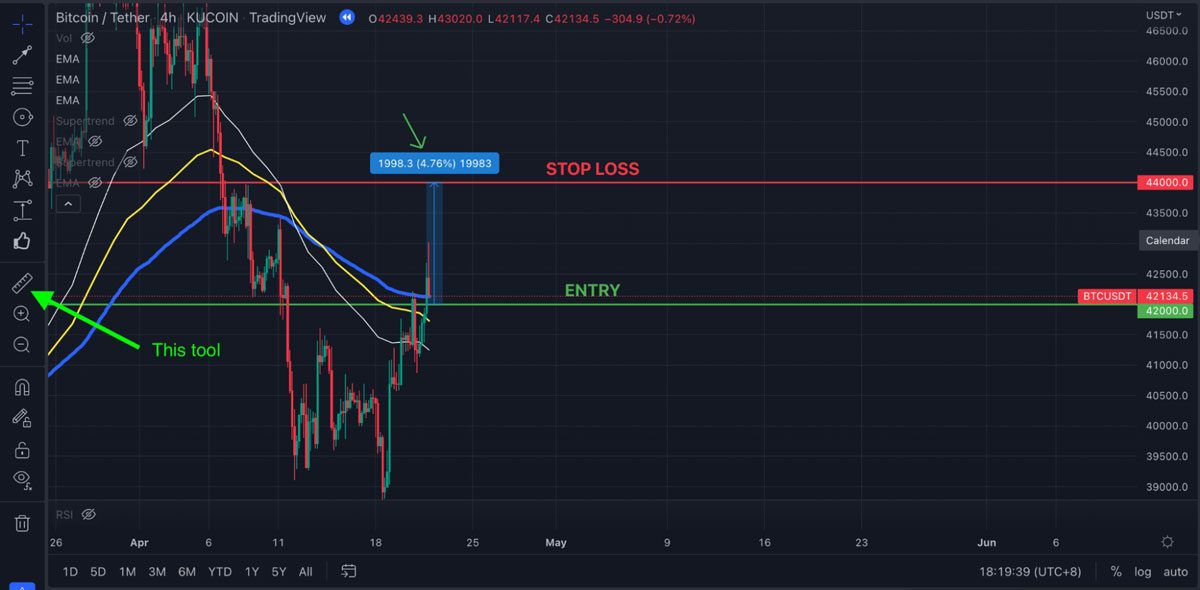
Entry: $42,000
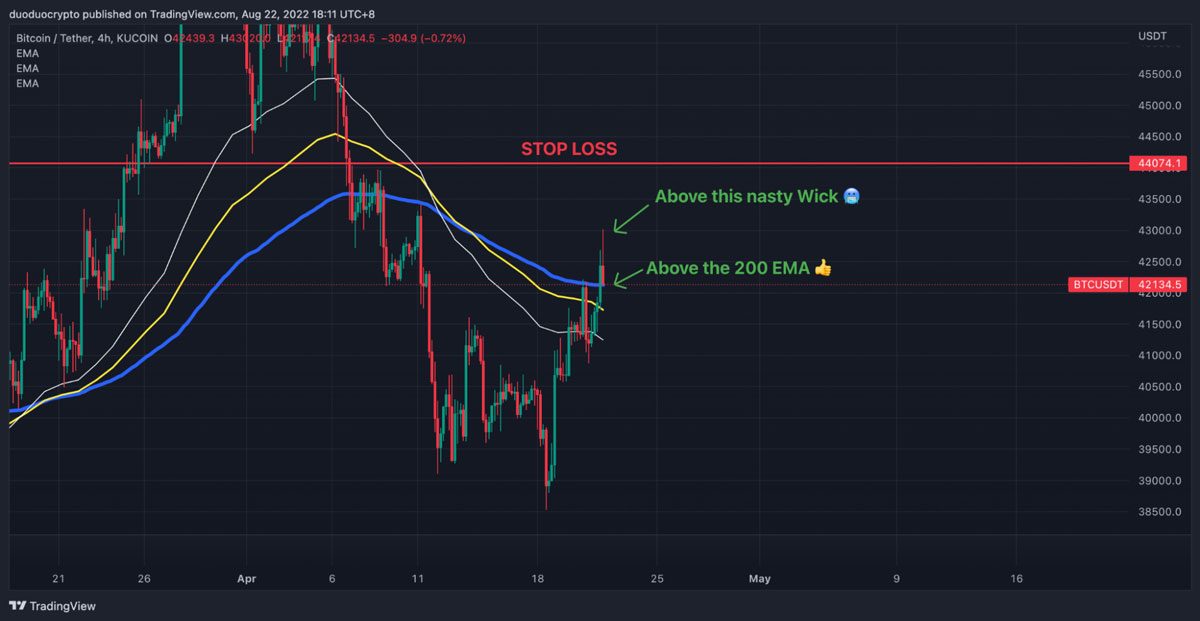
Stoploss: $44,000
Take Profit: $37,226
RR ratio: 2.3
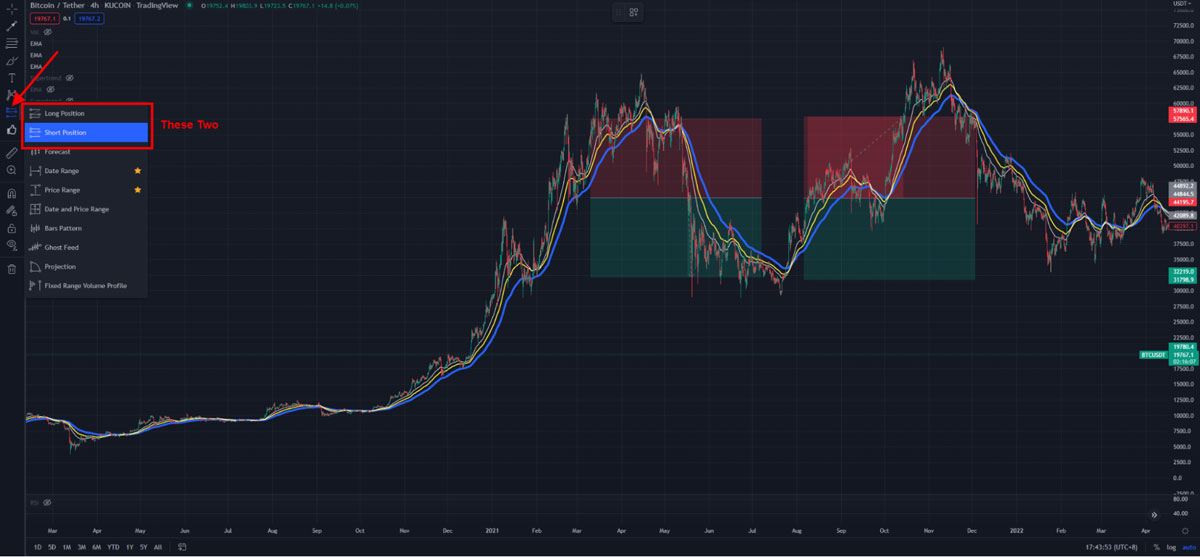
Now that you’ve done your planning, it’s time to execute. The best place to create short orders is inside your Binance futures trading terminal.
- Go to Binance.com
- Open your Futures trading terminal (you can find it under derivatives, then select USD-M)
- Input your trading plan into the Binance trading form on the right side of your terminal.
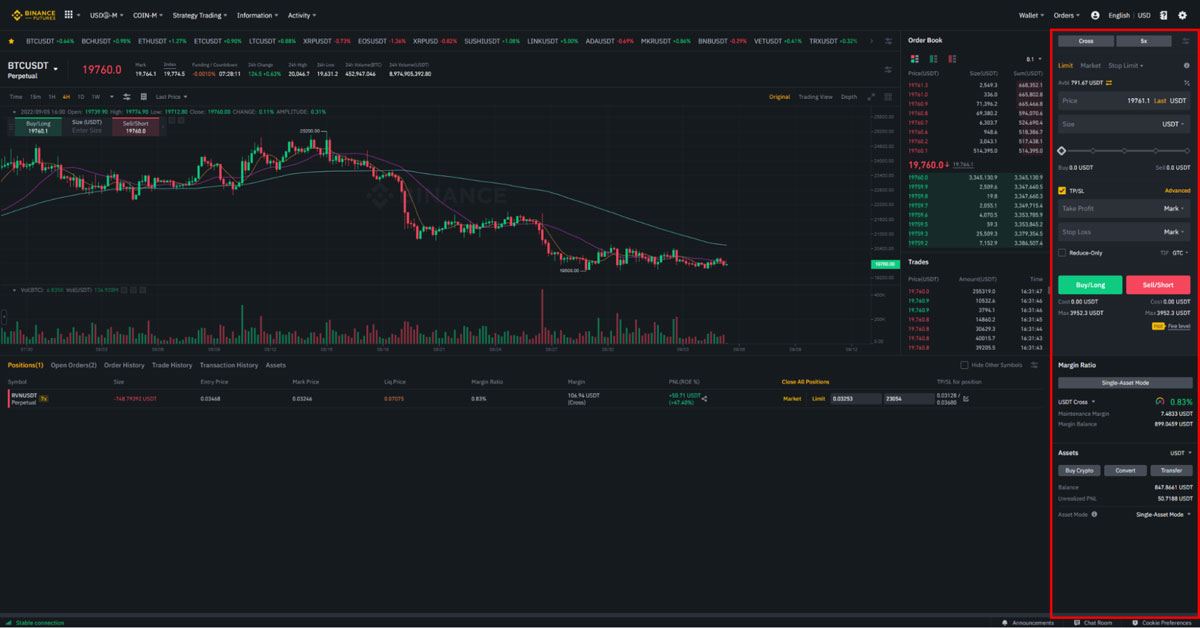
- After inputting your trade plan, click on the sell/short order to execute your trading plan
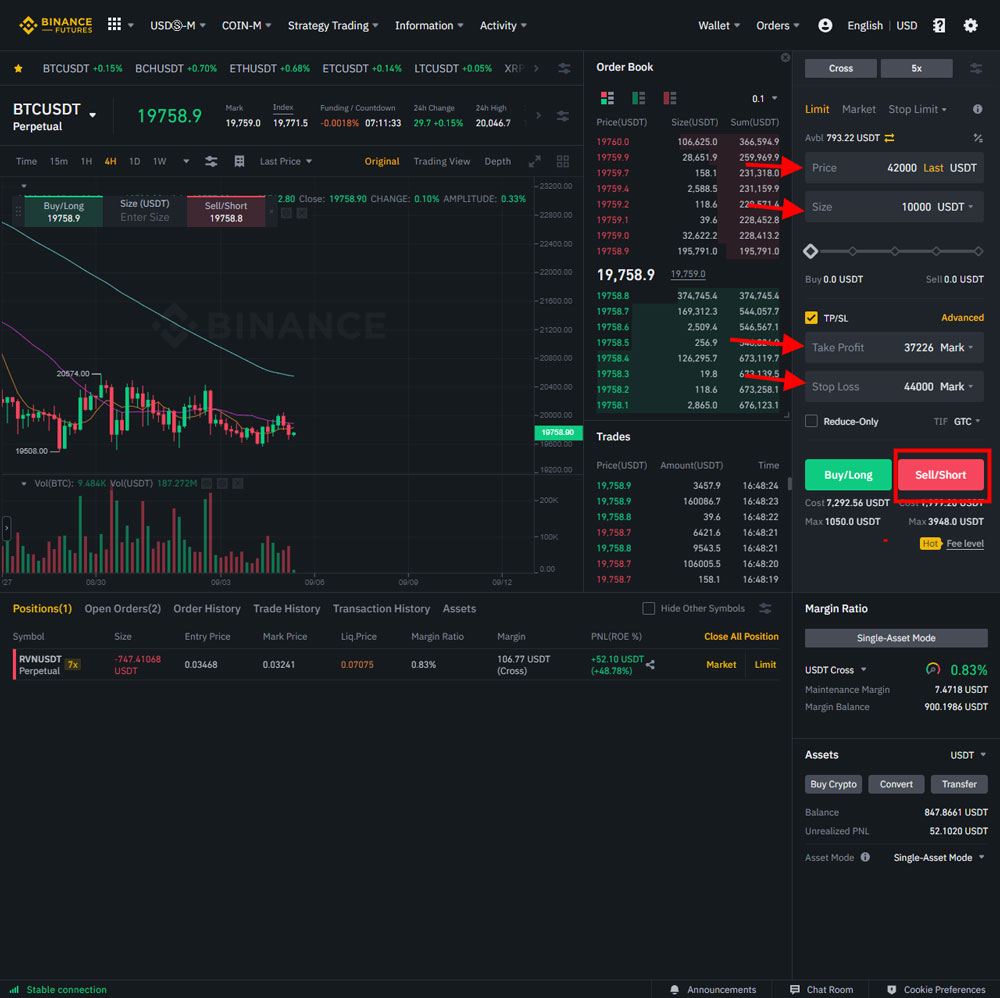
- Click on open orders to confirm your order is there.

- Sit and wait.
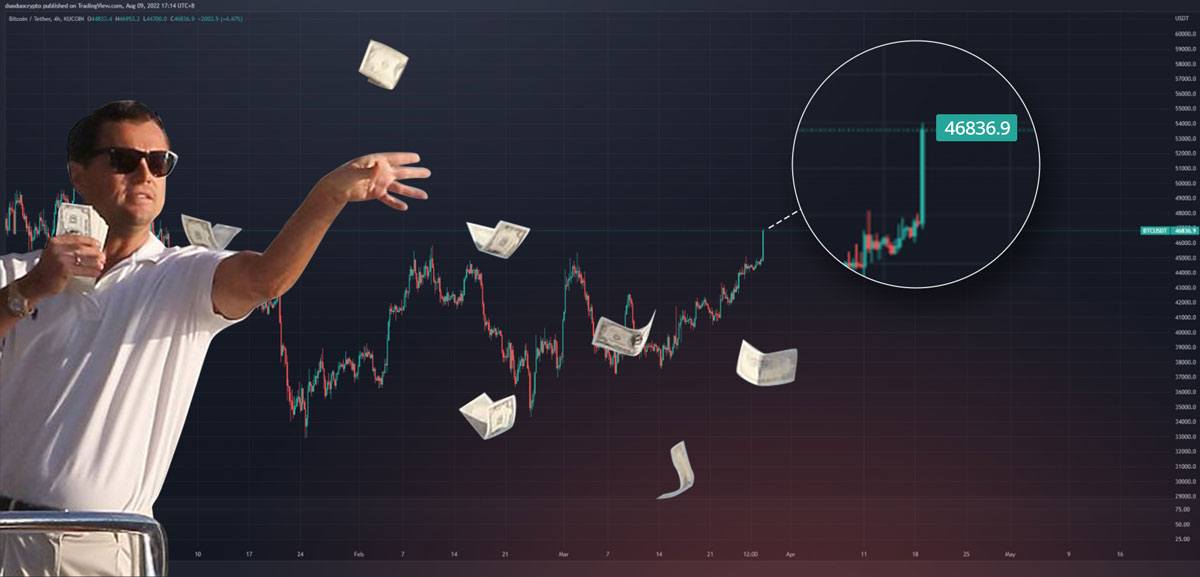
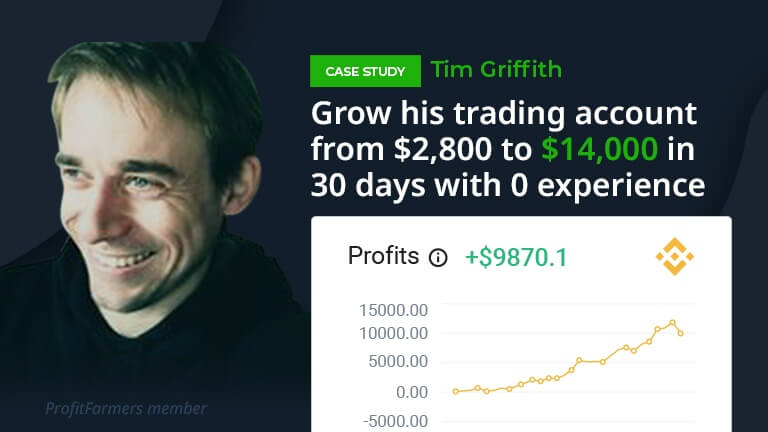
Luckily the trade goes in your favor and hits take profit 1
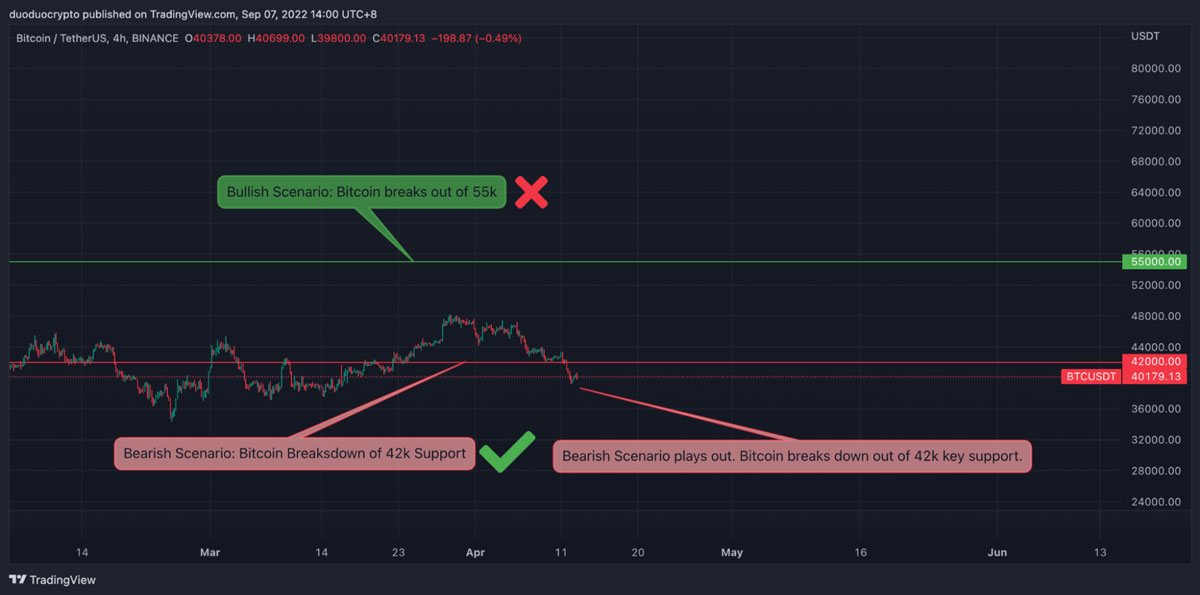
In fact, bitcoin fell all the way to 17k after our call in the market update, meaning even target 4 in this trade idea would have been hit!


