

See all the past video and blog result-breakdowns.


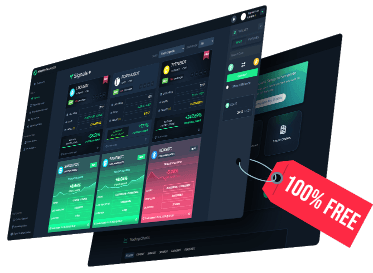
ProfitFarmers’ tools for traders of all levels.
An Advanced Cryptocurrency Trading Terminal built for Traders by Traders
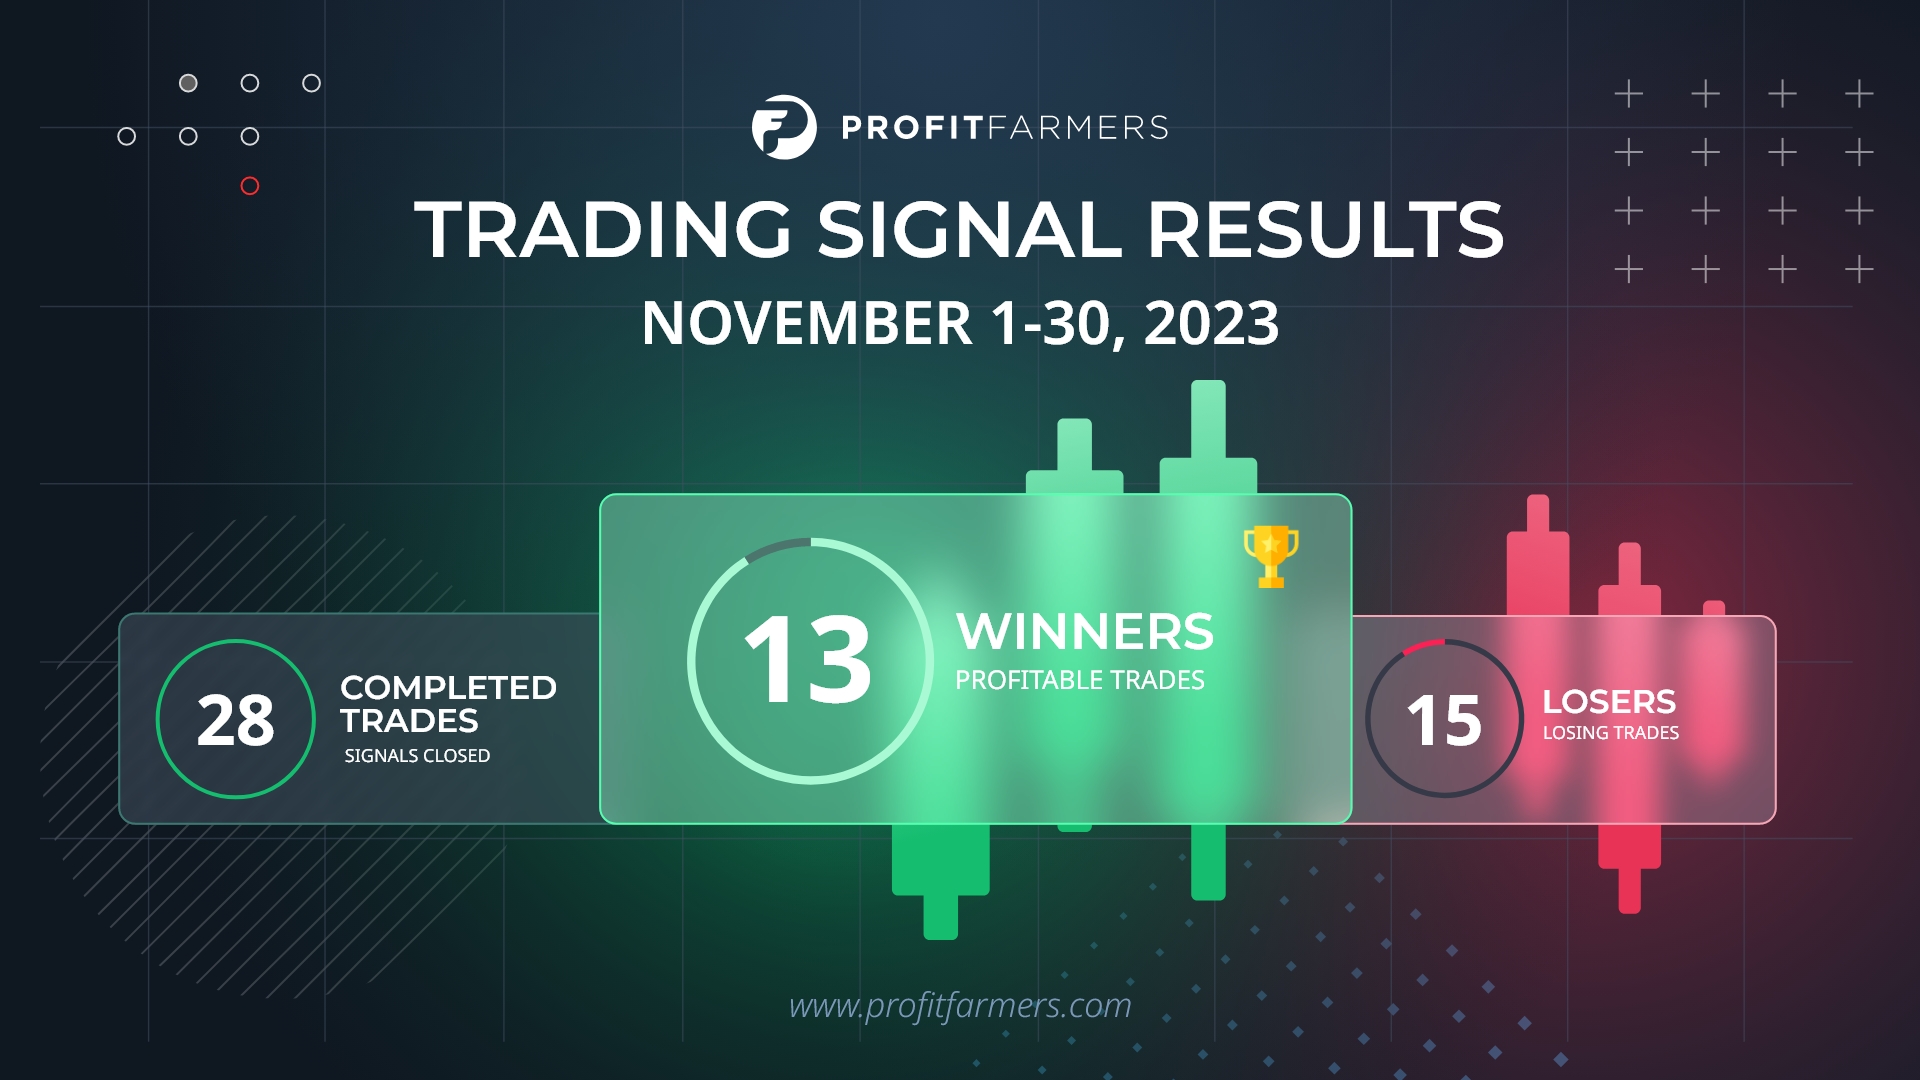
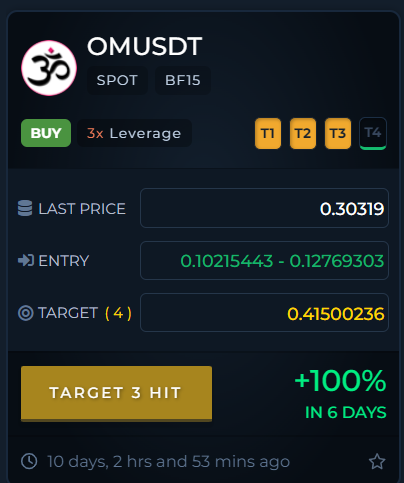
Premium Crypto Trading Signals
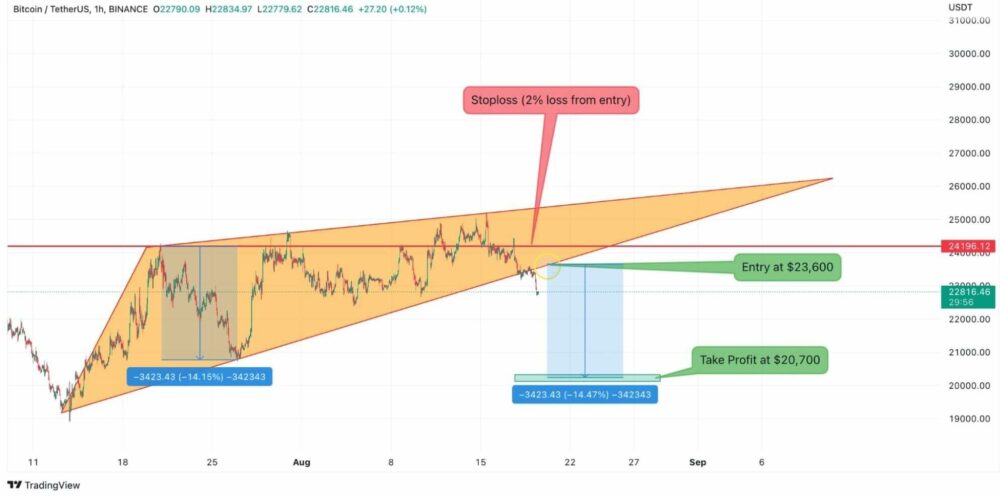
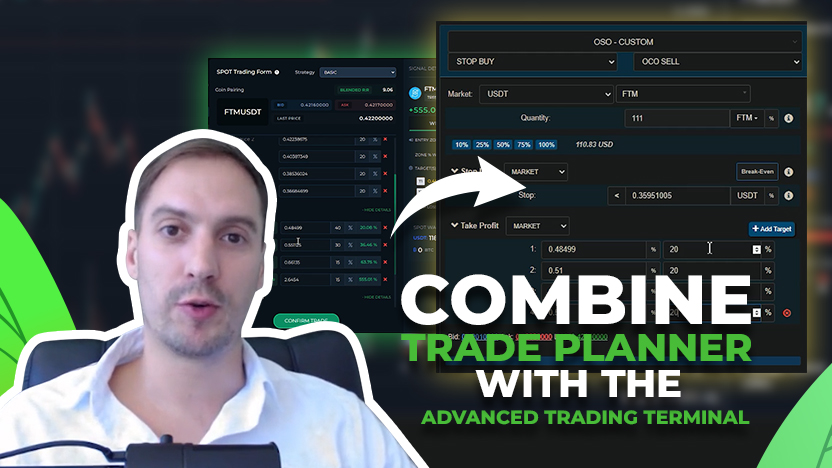
Advanced Trade Setups Made Simple!
Automatically moves your stop-loss up as your trade progresses
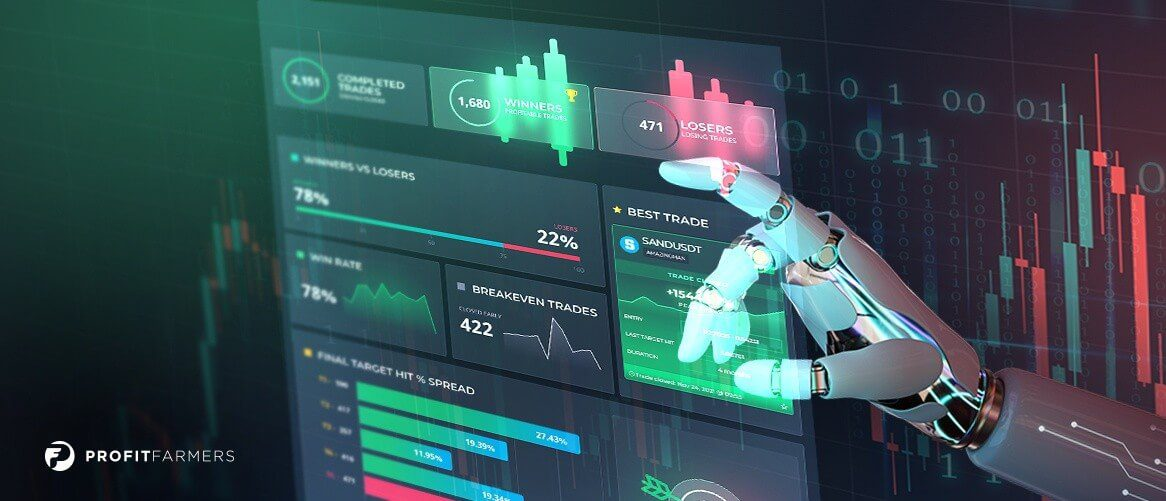
Find high probability trade opportunities at a glance
Find high probability trades by spotting cryptos that have been overbought or oversold
Automatically split your entry across 5 different prices within the entry zone.
Automatically exits trades for you when they deviate from the plan
Easily identify and execute professional trades that fit your long term trading goals
ProfitFarmers Free Educational Videos


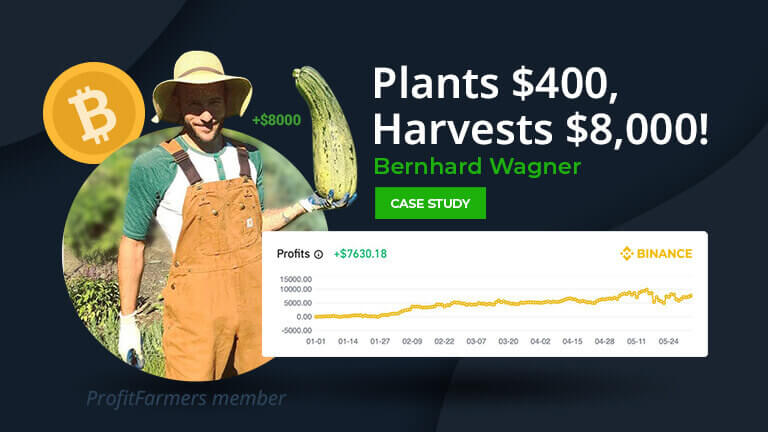
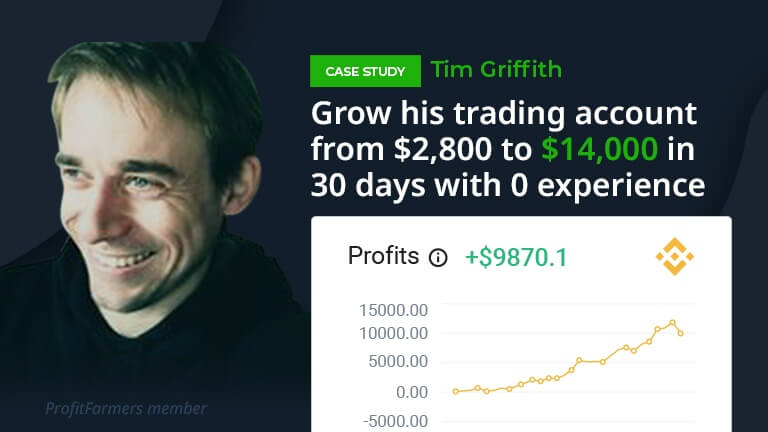
See our members are farming success from all around the globe
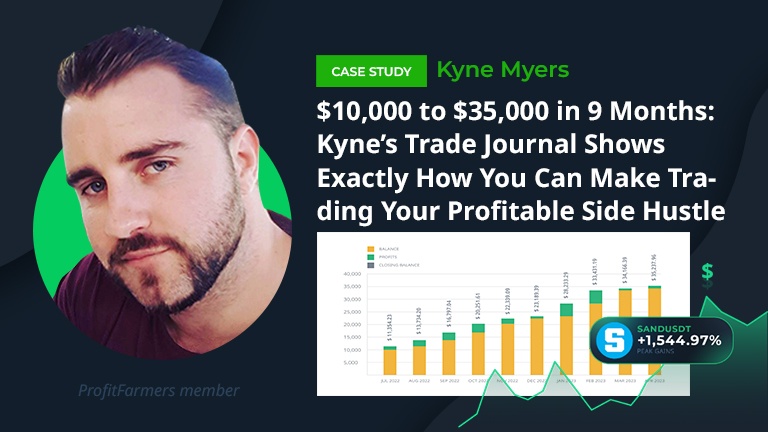
$10,000 to $35,000 in 9 Months: Kyne’s Trade Journal Shows Exactly How You Can Make Trading Your Profitable Side Hustle
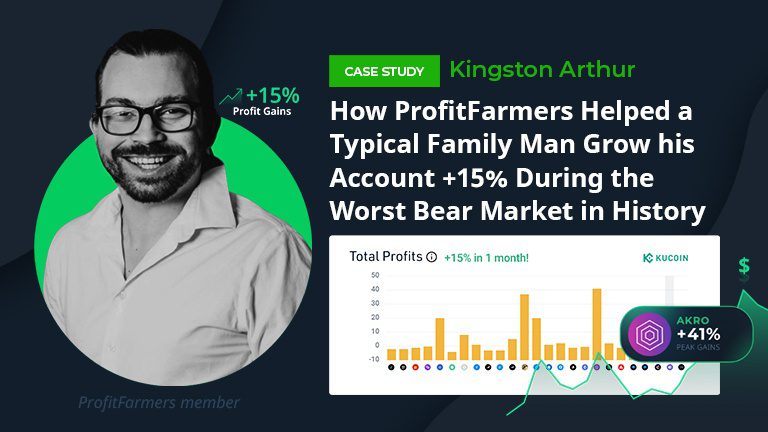
How ProfitFarmers Helped a Typical Family Man Grow his Account +15% During the Worst Bear Market in History + 0
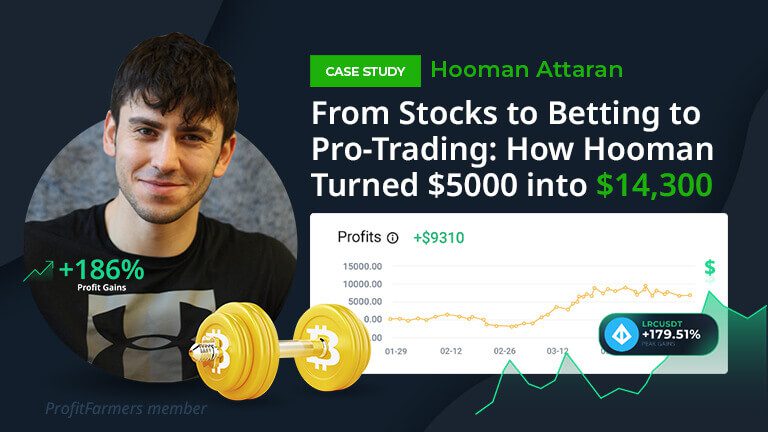
From Stocks to Betting to Pro-Trading: How Hooman Turned $5000 into $14,300 Hooman understood that to become rich, he would
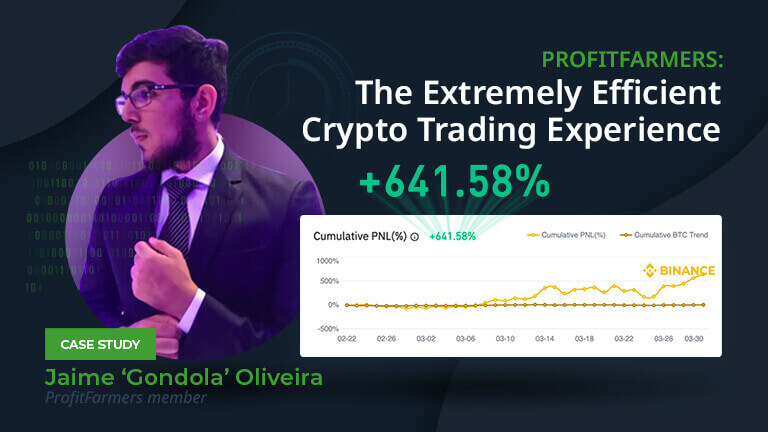
Jaime ‘Gondola’ Oliveira How a Software Engineer Used ProfitFarmers to take back his most valuable asset: Time Think a ProfitFarmers
Learn more about us
Any question or remarks? Just write us a message!


