


Hey there ProfitFarmers,
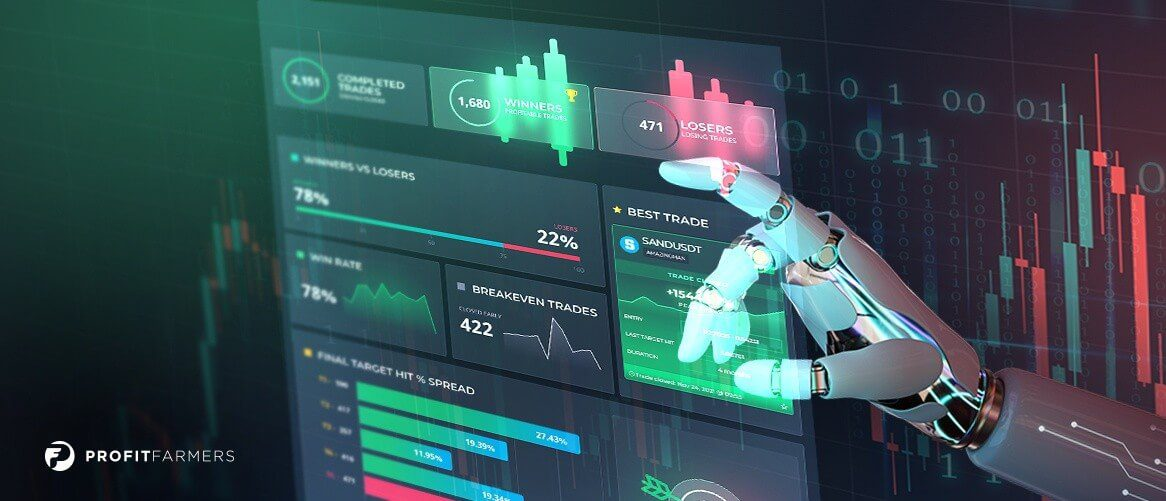
The dashboard is your main view of all the trading signals available, trading signal progress, completed trades/signals, wallet balances and more!
We wanted to breakdown how we calculate all of the various statistics and measurements on the dashboard and how it works!
Signals On The Dashboard Are Not Unique To Each User
First and foremost the most important thing to be clear upon is that the dashboard view is ‘global’. What this means is that you are seeing the same signals, progress and results as all other members within your package tier.
This only applies to the signals themselves. Your wallet balances, settings etc are unique to you.
The system is designed to host the signals and allow the copy-trading features to operate. To do this we track an individual signal from entry to exit by measuring the progress against various pieces of data from Binance.com.
You Can Customize Every Trade To Suit Your Strategy
Every member can trade uniquely by applying changes to the suggested setup on the basic trade form or the advanced form. Often this is to suit their own personal trading strategy, for example some users will want to turn on the breakeven stop-loss feature, or remove some of the targets.
On top of this, members may make changes in the middle of a trade using the manual trading terminal or directly inside Binance.com. For instance some members will move their stop-loss manually as a trade progresses or close a trade early if they feel the market is about to move against them.
As a result, this means that the statistics and measurements of each signal are 100% accurate (except for unexpected bugs or data issues) but they do not reflect your personal trade setup. The measurements are based upon entry to last target hit or entry to stop loss.
You can keep track of your own results by keeping a track of your balances. Take into account the rise and fall of Bitcoin vs USDT price. If you want a more detailed breakdown of your own trading results and history you will need to export your trade data from Binance.com and either crunch the numbers or pay for a 3rd party tracker tool.
What Are The Calculations?
Here are the formulas for each calculation seen on the dashboard. We appreciate these may not be easy to understand but are adding them for transparency. If you have particular questions feel free to submit a ticket.
Note that ‘entry start’ refers to the lower entry figure and ‘entry end’ refers to the upper entry figure forming the range.
POTENTIAL GAINS (pg)
In English: Middle of entry zone to target 4 = maximum possible potential gains on a new signal
middleValue = (entryStartPrice + entryEndPrice) / 2
BUY signal:
difference = target4Price – middleValue
pg = (difference / middleValue) * 100
SHORT signal:
difference = middleValue – target4Price
pg = (difference / target4Price) * 100
SINCE ENTRY
(visible only if signal state is AWAITING TARGET)
In English: Deepest Entry Price recorded or top of entry zone to current market price = %gain
IF deepestEntryHitPrice has value
baseEntryPrice = deepestEntryHitPrice
Otherwise,
baseEntryPrice = entryEndPrice
BUY signal:
x = (lastPrice – baseEntryPrice) / baseEntryPrice
x *= 100
SHORT signal:
x = (baseEntryPrice – lastPrice) / lastPrice
x *= 100
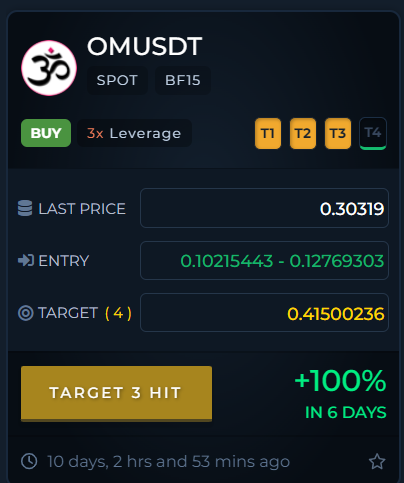
GAINS per target hit
In English: Deepest Entry Price recorded or middle of entry zone to Target price = %gain
IF deepestEntryHitPrice has value
baseEntryPrice = deepestEntryHitPrice
Otherwise,
baseEntryPrice = (entryStartPrice + entryEndPrice) / 2
BUY signal:
x = (targetHitPrice – baseEntryPrice) / baseEntryPrice
x *= 100
SHORT signal:
x = (baseEntryPrice – targetHitPrice) / targetHitPrice
x *= 100
STOP LOSS HIT
In English: Middle of entry zone to stop-loss price = %loss
middleValue = (entryStartPrice + entryEndPrice) / 2
BUY signal:
loss = (stopLossPrice – middleValue) / stopLossPrice
loss *= 100
SHORT signal:
loss = (middleValue – stopLossPrice) / middleValue
loss *= 100


